
Introduction to Water Level Process
The Water Level Process machine plays a crucial role in numerous industrial and infrastructure systems where the monitoring and control of water levels are vital. It is an essential component in various applications such as water treatment plants, reservoirs, irrigation systems, and flood control mechanisms. The accurate measurement and control of water levels are critical for ensuring optimal operation, preventing overflows or shortages, and maintaining overall system stability.
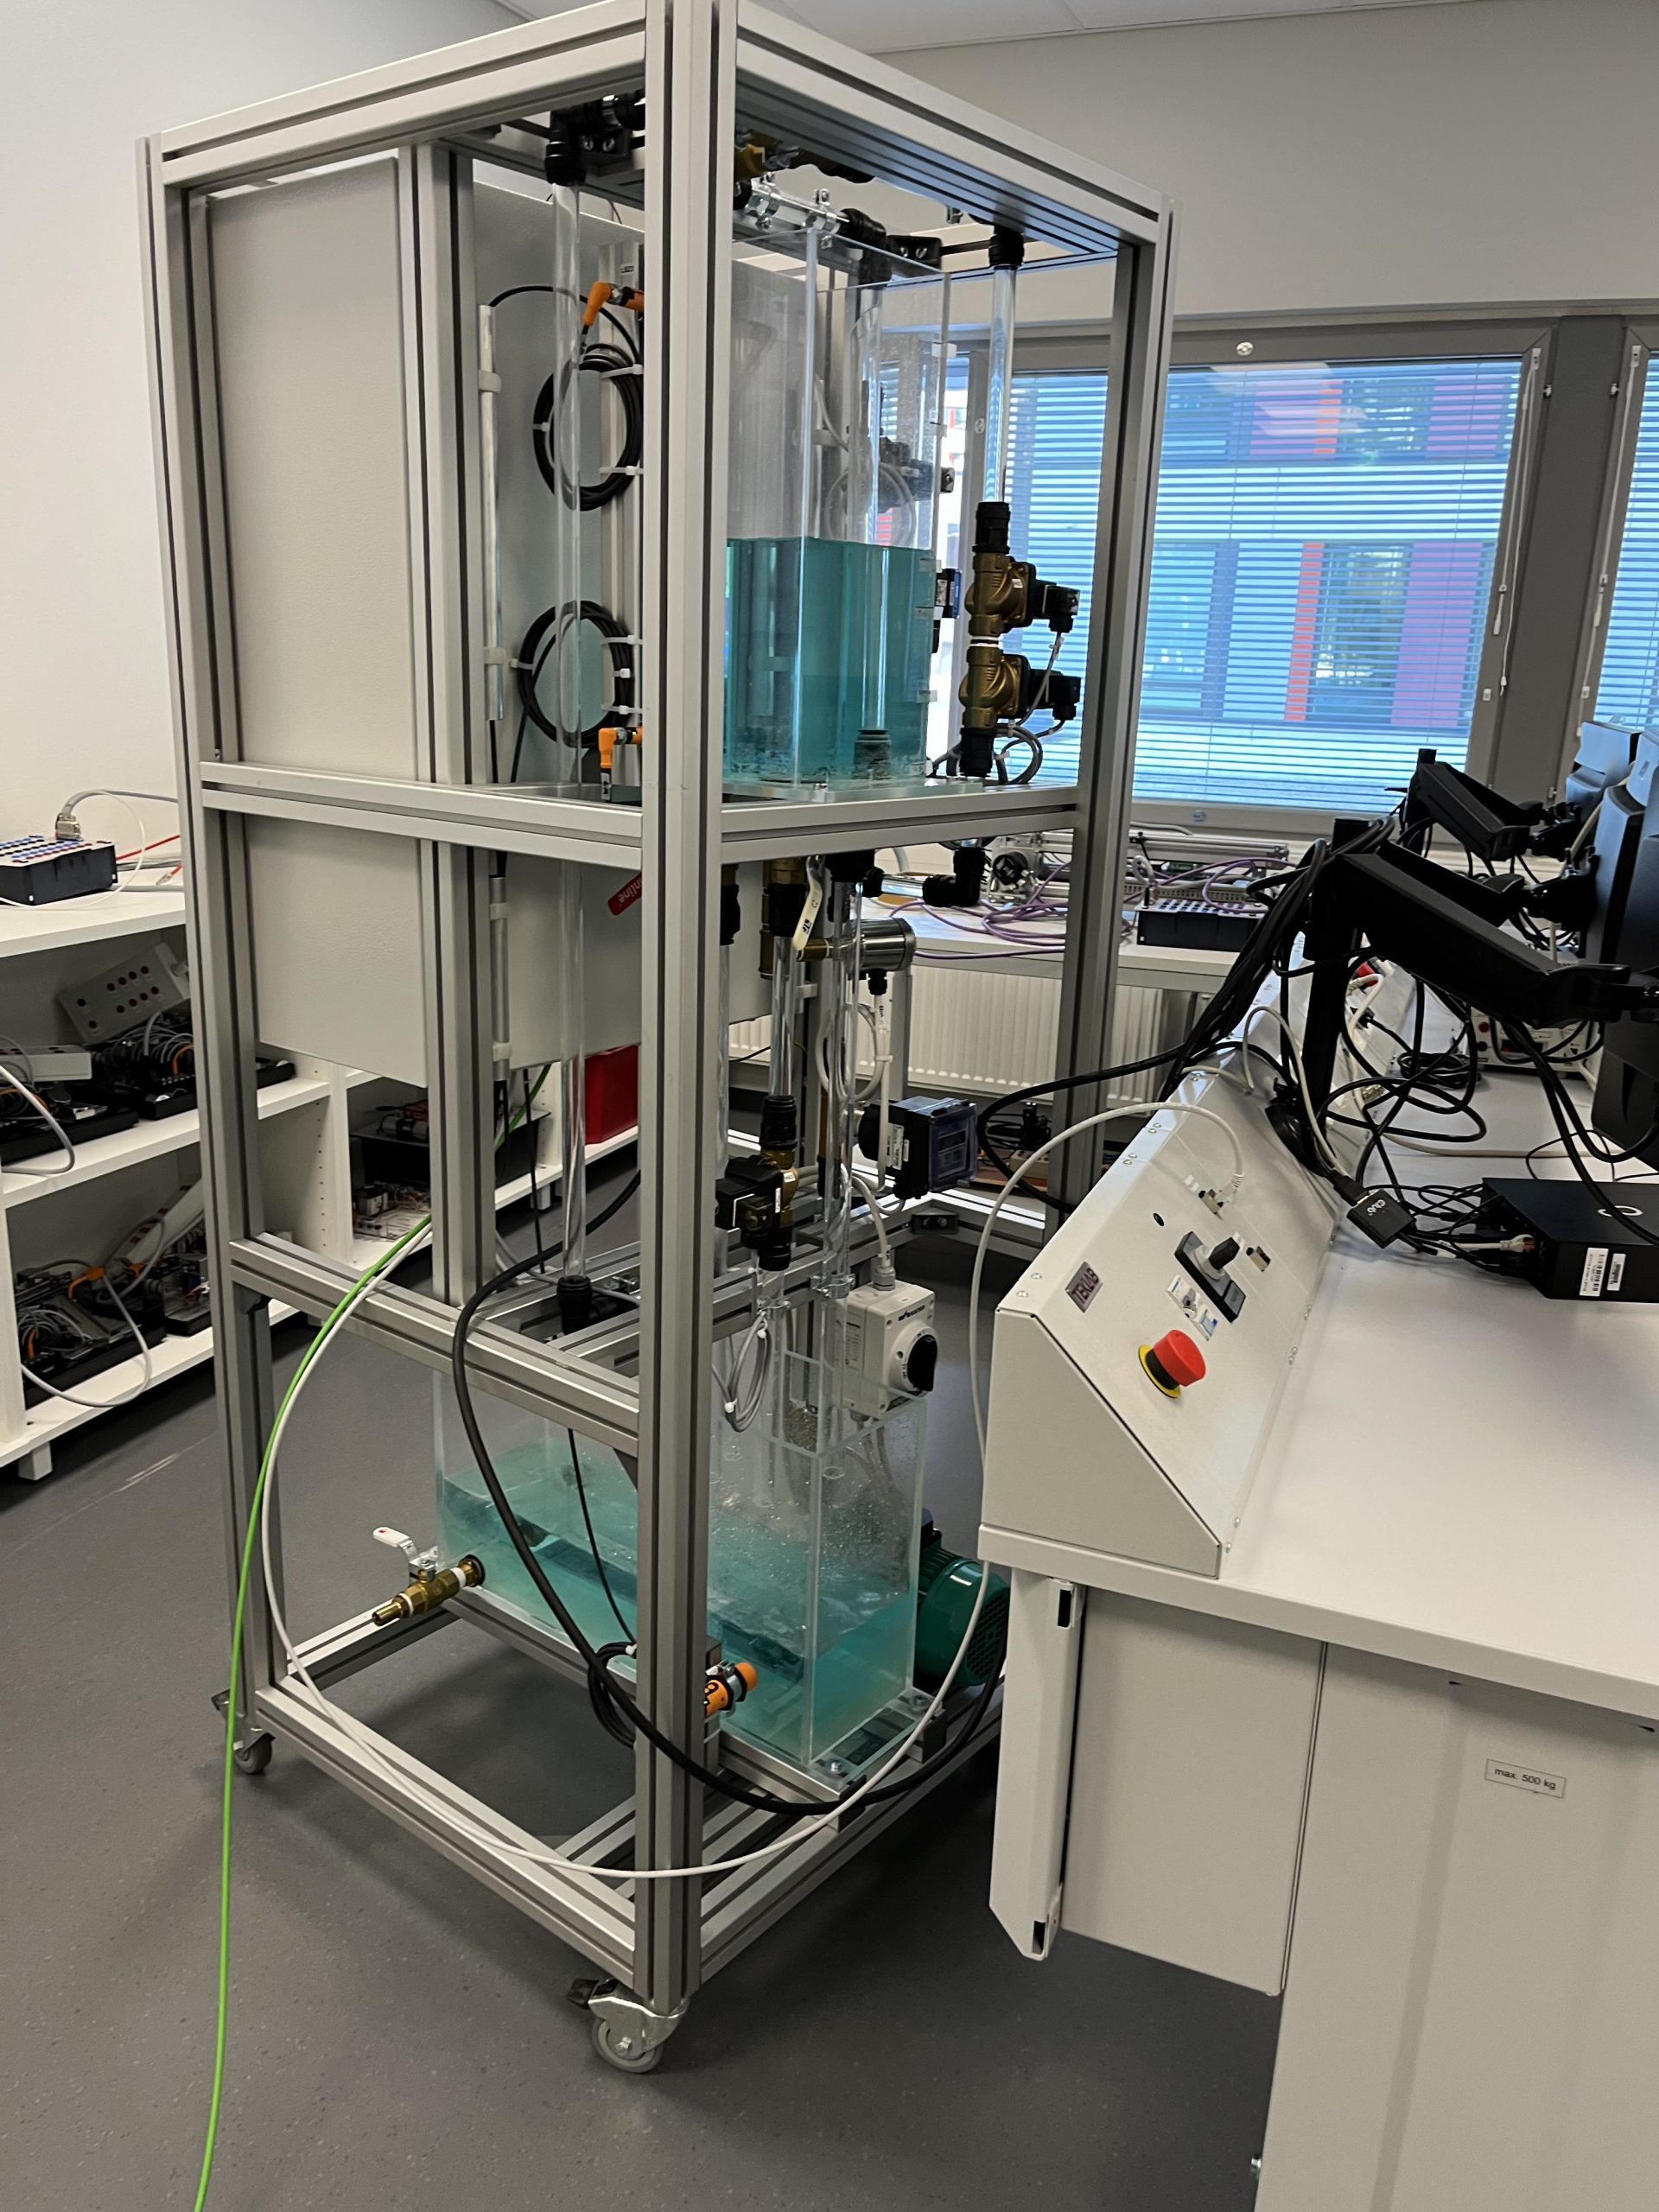
The Water Level Process machine operates by continuously monitoring the water level in a designated area or container and employing control mechanisms to regulate and maintain the desired water level. This process involves the integration of sensors, actuators, and control systems to achieve precise and automated control of water levels. Figure 1 shows water process machine.
In recent years, advancements in automation and data analysis have revolutionized the capabilities of Water Level Process machines. Integration with cloud-based platforms, such as MindSphere, has enabled the collection, storage, and analysis of water level data in real-time. This integration opens up opportunities for data-driven decision-making, predictive maintenance, and optimization of water level processes. Cloud-based platforms provide enhanced accessibility, scalability, and analytical capabilities, empowering users to gain deeper insights into the system’s behavior and performance.
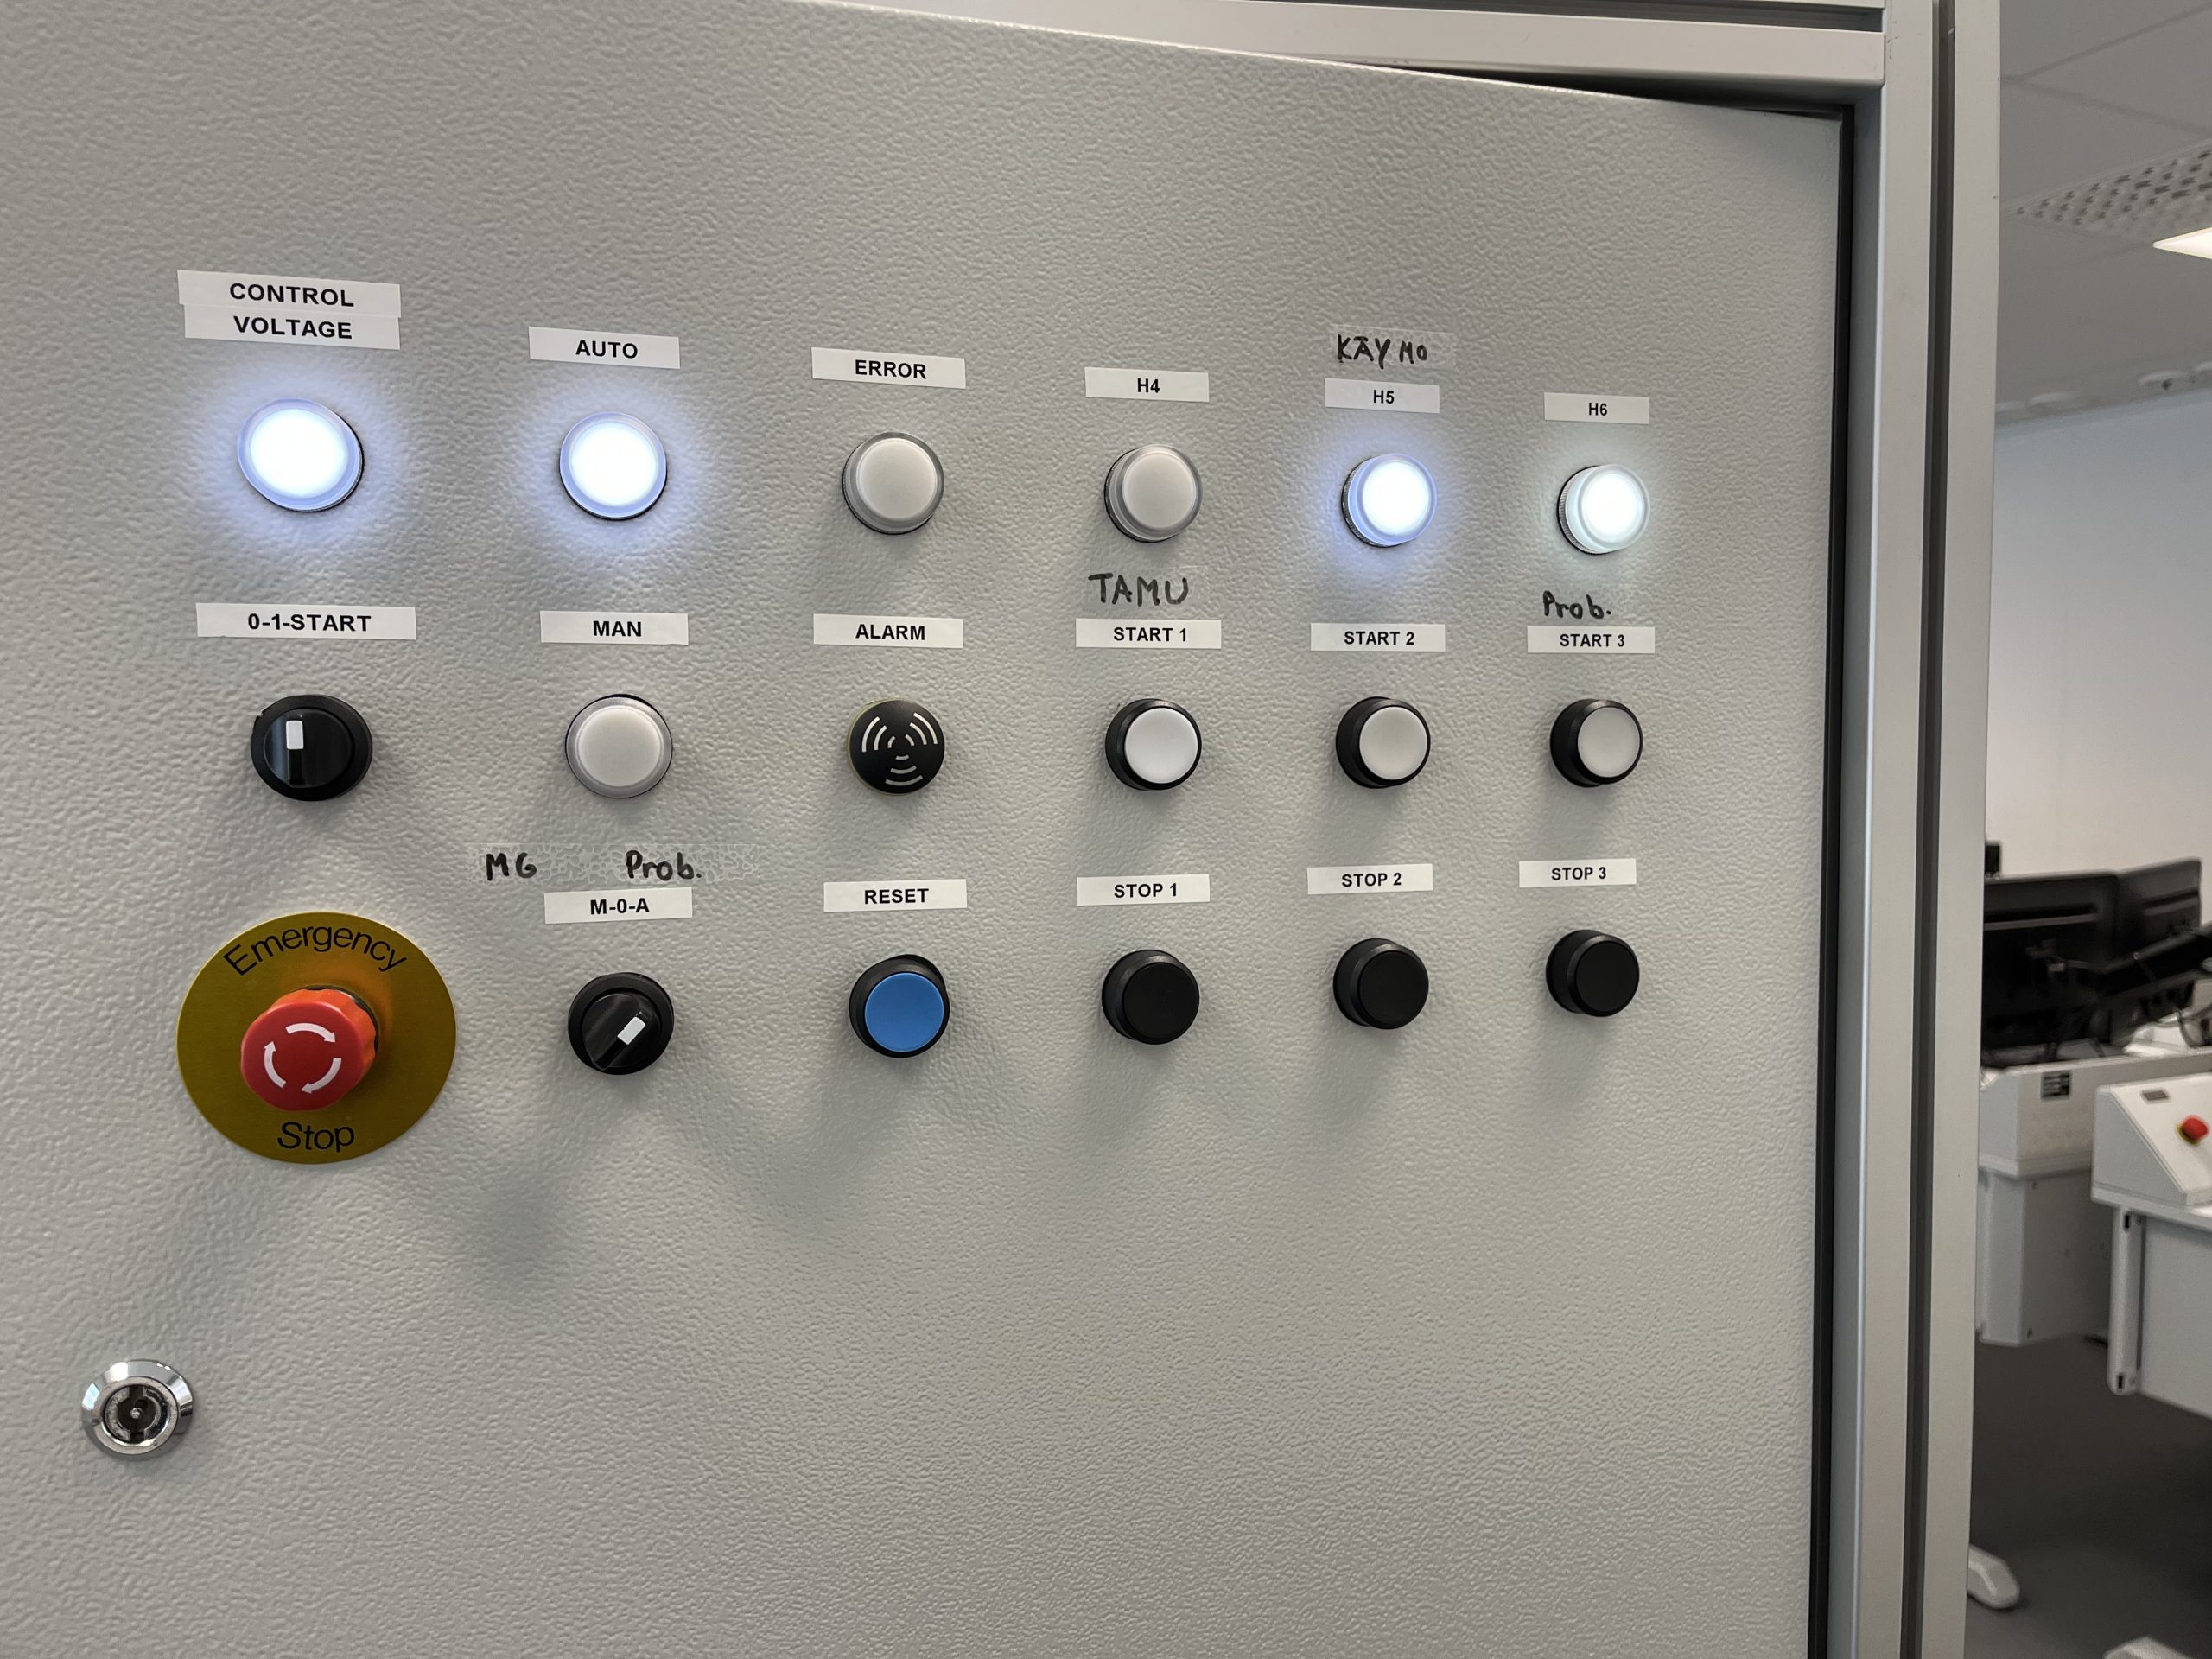
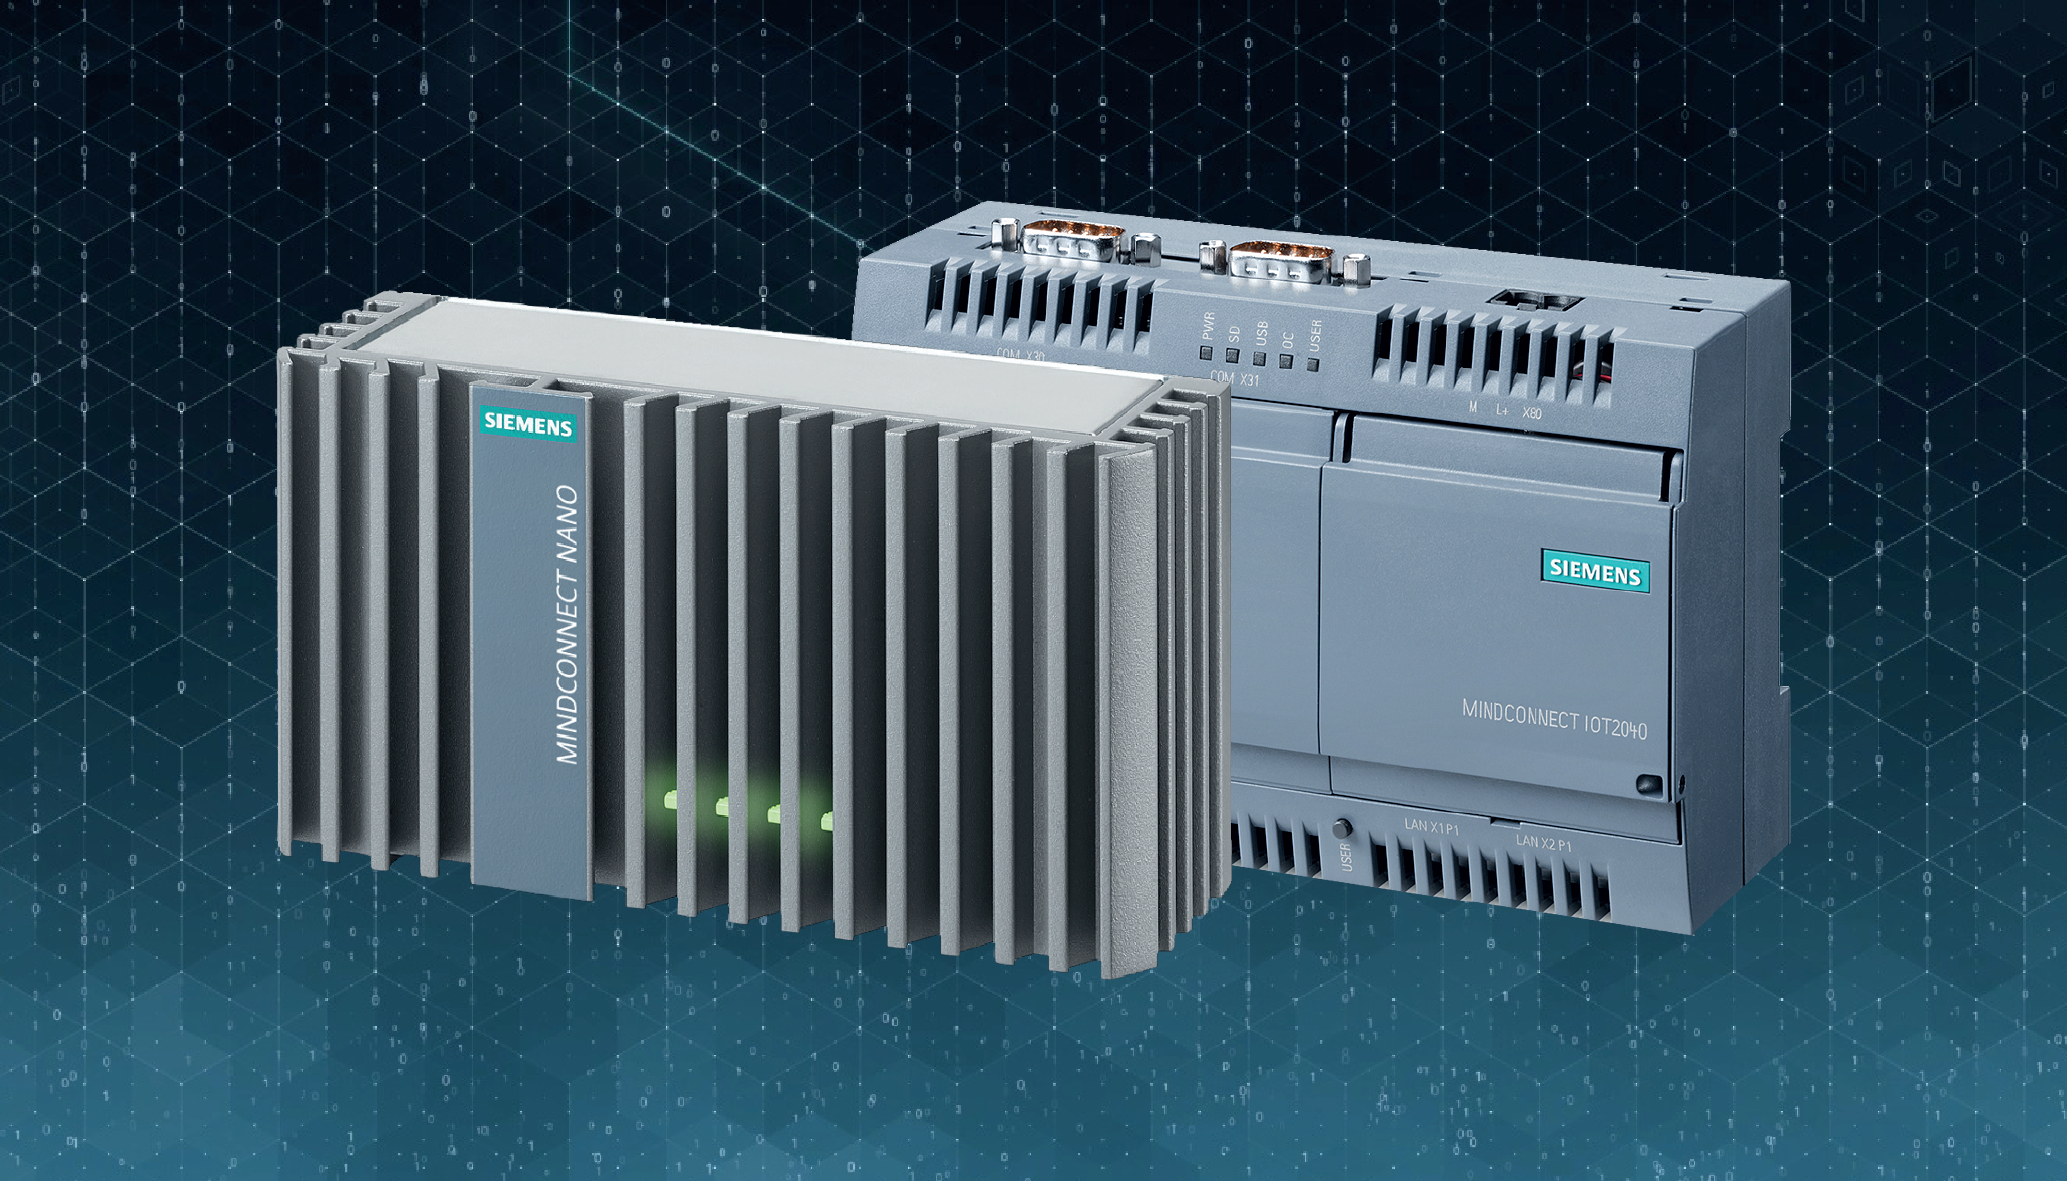
Figure 2 refers the main controller board. The buttons are controlling the voltage of the machine, alarms, emergency stop, start, and stop the machine respectively. Figure 3 shows the mindconnect nano device which is connected to Mindsphere.
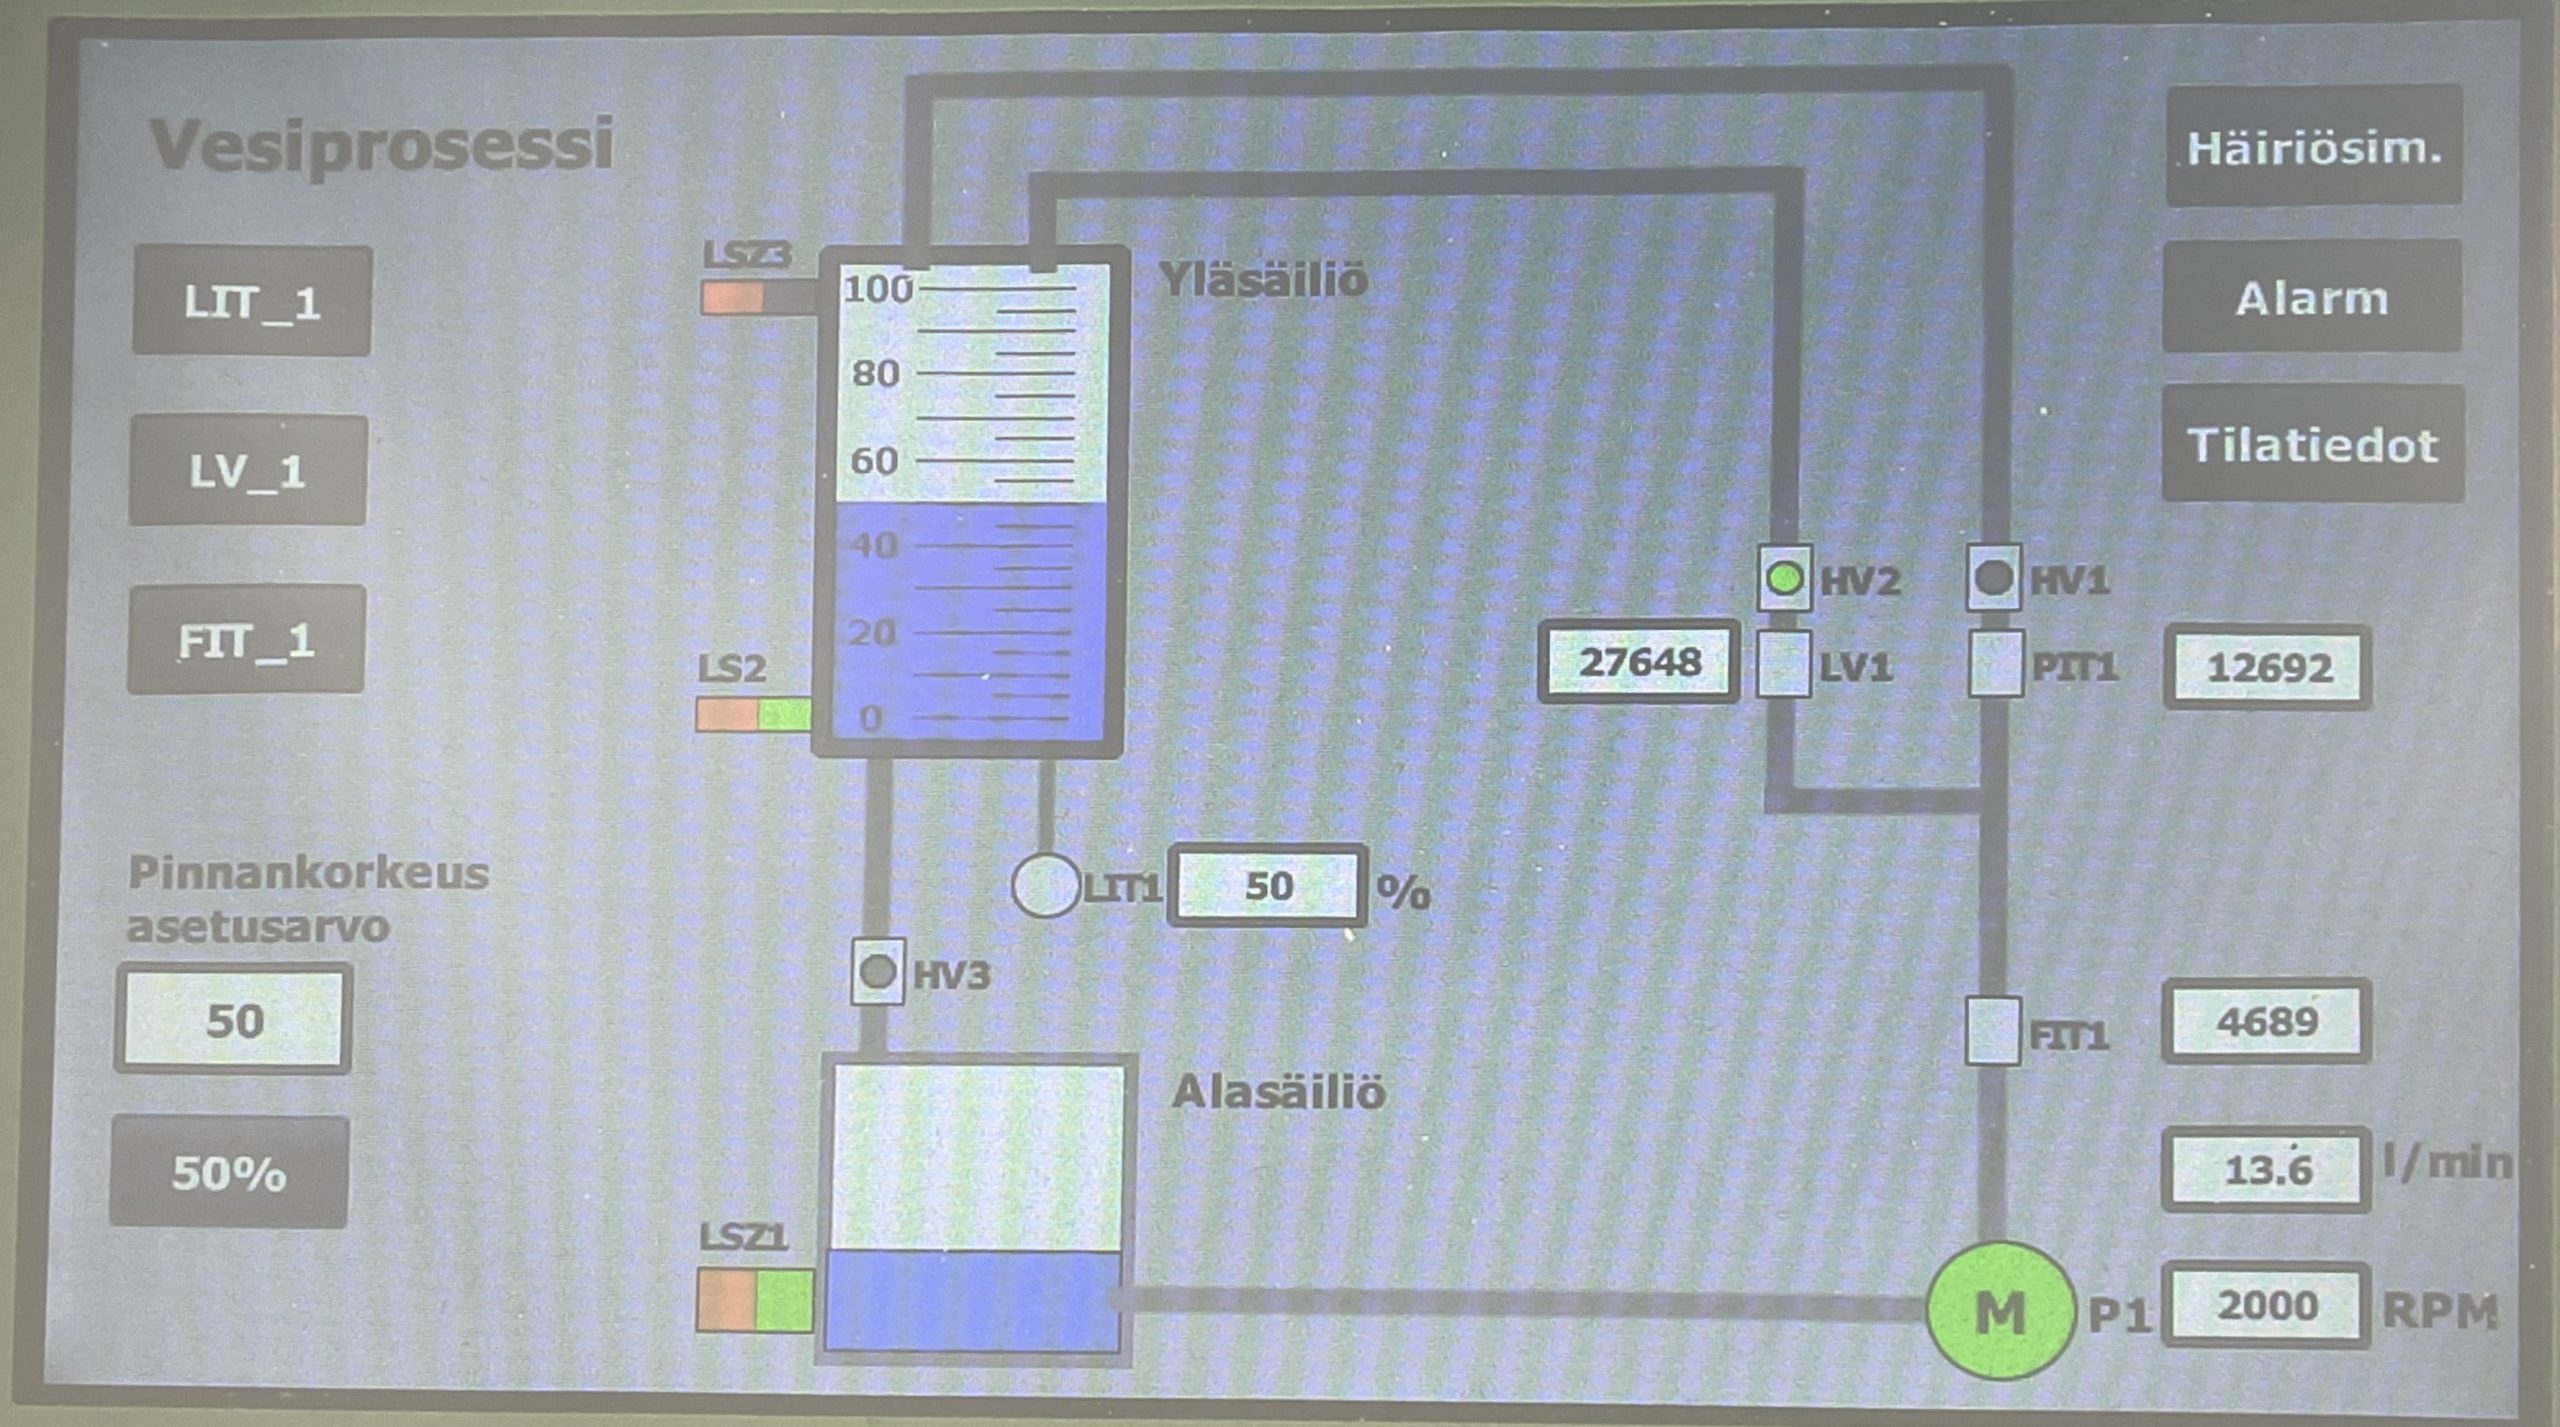
The set point can be changed by the user using the HMI screen. Flowing the water in the upper tank is displayed on the HMI screen as Figure 4 shows.
The pressure gauge in the water level process serves as a crucial component for monitoring and measuring the pressure exerted by the water within the system. It is designed to provide accurate and real-time information about the pressure levels, enabling operators to maintain optimal operational conditions and ensure the safety and efficiency of the process. The pressure gauge is typically installed at a strategic location within the water level system, where it can effectively measure the pressure exerted by the water. It consists of a pressure-sensing element, which converts the applied pressure into a readable signal or display. This sensing element may employ various technologies, including diaphragm, Bourdon tube, or strain gauge, depending on the specific requirements and design of the water level process as Figure 5 refer.
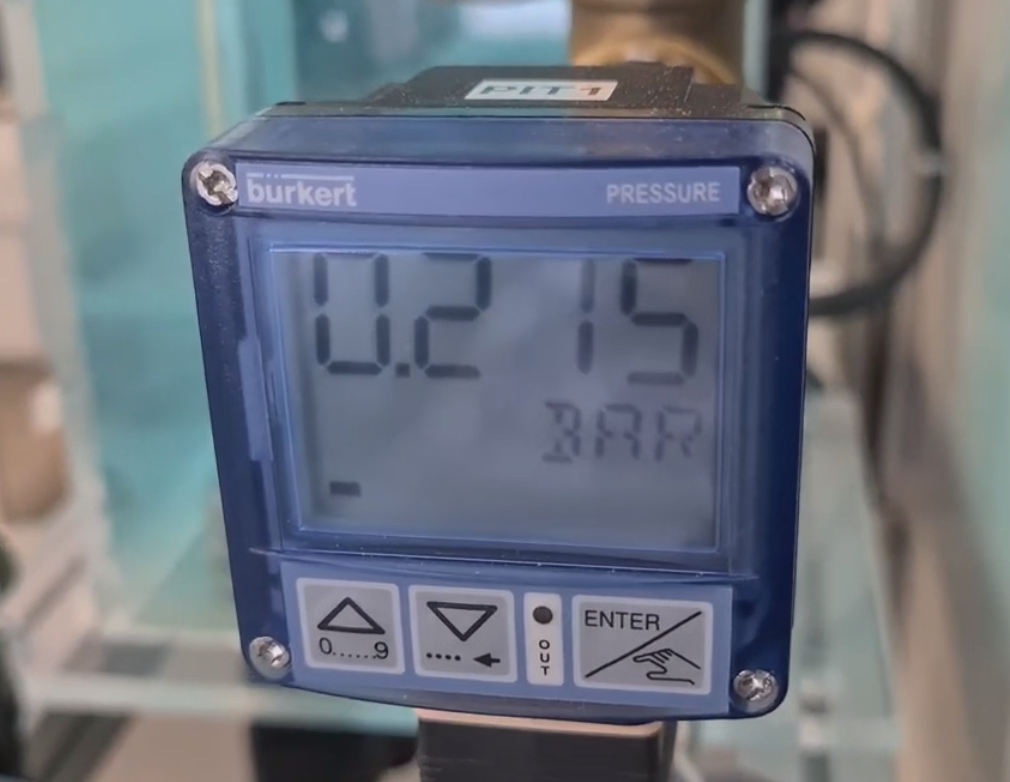
The pressure gauge is connected to the water level system through appropriate fittings or connections, allowing for the transfer of pressure to the sensing element. As the water level fluctuates or the flow rate changes, the pressure gauge detects these variations and provides corresponding readings. These readings are typically displayed on a dial or digital display located on the gauge itself. The information provided by the pressure gauge is crucial for operators and control systems to monitor and adjust the water level process effectively. By observing the pressure readings, operators can identify abnormal conditions such as excessive pressure, which may indicate blockages, restrictions, or other issues within the system. This early detection of anomalies allows for prompt intervention and corrective actions to prevent damage or malfunction.
PID
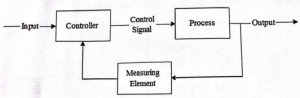
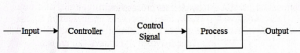
The PID controller regulates and maintains the desired water level in the system. It consists of three control components: the proportional, integral, and derivative terms. The proportional term adjusts the control output based on the current error between the desired set point and the actual water level. The integral term integrates the past errors over time to reduce steady-state errors and improve system stability. The derivative term predicts the future trend of the error and adjusts the control output accordingly to enhance the system’s response to changes.
The PID controller receives input from sensors that measure the water level and calculates the appropriate control signal to actuate valves, pumps, or other actuators in the water level process. By continuously monitoring the water level and comparing it to the set point, the PID controller adjusts the control signal to maintain the desired level. The control signal generated by the PID controller influences the actuators in a way that either increases or decreases the flow of water in the system, aiming to minimize the error between the set point and the actual water level. Through this continuous feedback loop, the PID controller strives to achieve precise control and maintain stability in the water level process.
The effectiveness of the PID controller lies in its ability to adapt and respond to changing conditions. The control parameters, including the proportional, integral, and derivative gains, can be adjusted to optimize the controller’s performance based on the specific characteristics of the water level process. By fine-tuning these parameters, the PID controller can achieve improved response times, minimize overshooting or undershooting, and enhance the overall control performance. P stands for proportional. The block creates an output signal proportional to the magnitude of the Error. Rate of response changing by adjusting the P-gain value increases or decreases the rate of response. Figure 6 refer proportional diagram.
PI stands for integral. The integral block creates an output proportional to the duration and magnitude of the Error Signal. Integral controller acts until Error value is zero, thus eliminates steady state error. Figure 7 shows integral diagram.
PID stands for derivative. The derivative block outputs a signal proportional to the rate of change of the Error signal. Grater the error rate of change, larger the derivative output. D-controller anticipates the future error behaviour. Figure 8 shows derivative diagram.
MindSphere Server
Mindsphere is a cloud based, open IoT operating system developed by Siemens. It allows companies to connect their machines, plants, and other assets to the internet and collect data from them, which can be analyzed to improve performance, optimize maintenance, and reduce downtime. The MindSphere server is utilized to provide a platform where the data can be accessed and viewed by the user. It serves as a centralized repository for storing and managing the data collected from the water level process. The MindSphere server offers a range of features and functionalities that enable users to effectively analyze and interpret the data.
Data from various sources, such as sensors and control systems, are transmitted to the MindSphere server for storage and processing. This data includes crucial parameters like motor speed, water flow rate, and errors, among others, which are essential for understanding the performance and behavior of the water level process. By leveraging the capabilities of the MindSphere server, users can access the collected data through a user-friendly interface. The server provides visualization tools, charts, and graphs that allow users to explore and analyze the data in a comprehensive manner. This visual representation of the data aids in identifying patterns, trends, and anomalies, providing valuable insights into the performance and efficiency of the water level process.
Additionally, the MindSphere server offers data analysis capabilities, allowing users to apply advanced analytical techniques to extract meaningful information from the collected data. Users can employ statistical analysis, machine learning algorithms, and other data processing methods to gain deeper insights into the behavior and performance of the water level process. This enables users to make informed decisions, optimize operations, and identify areas for improvement.
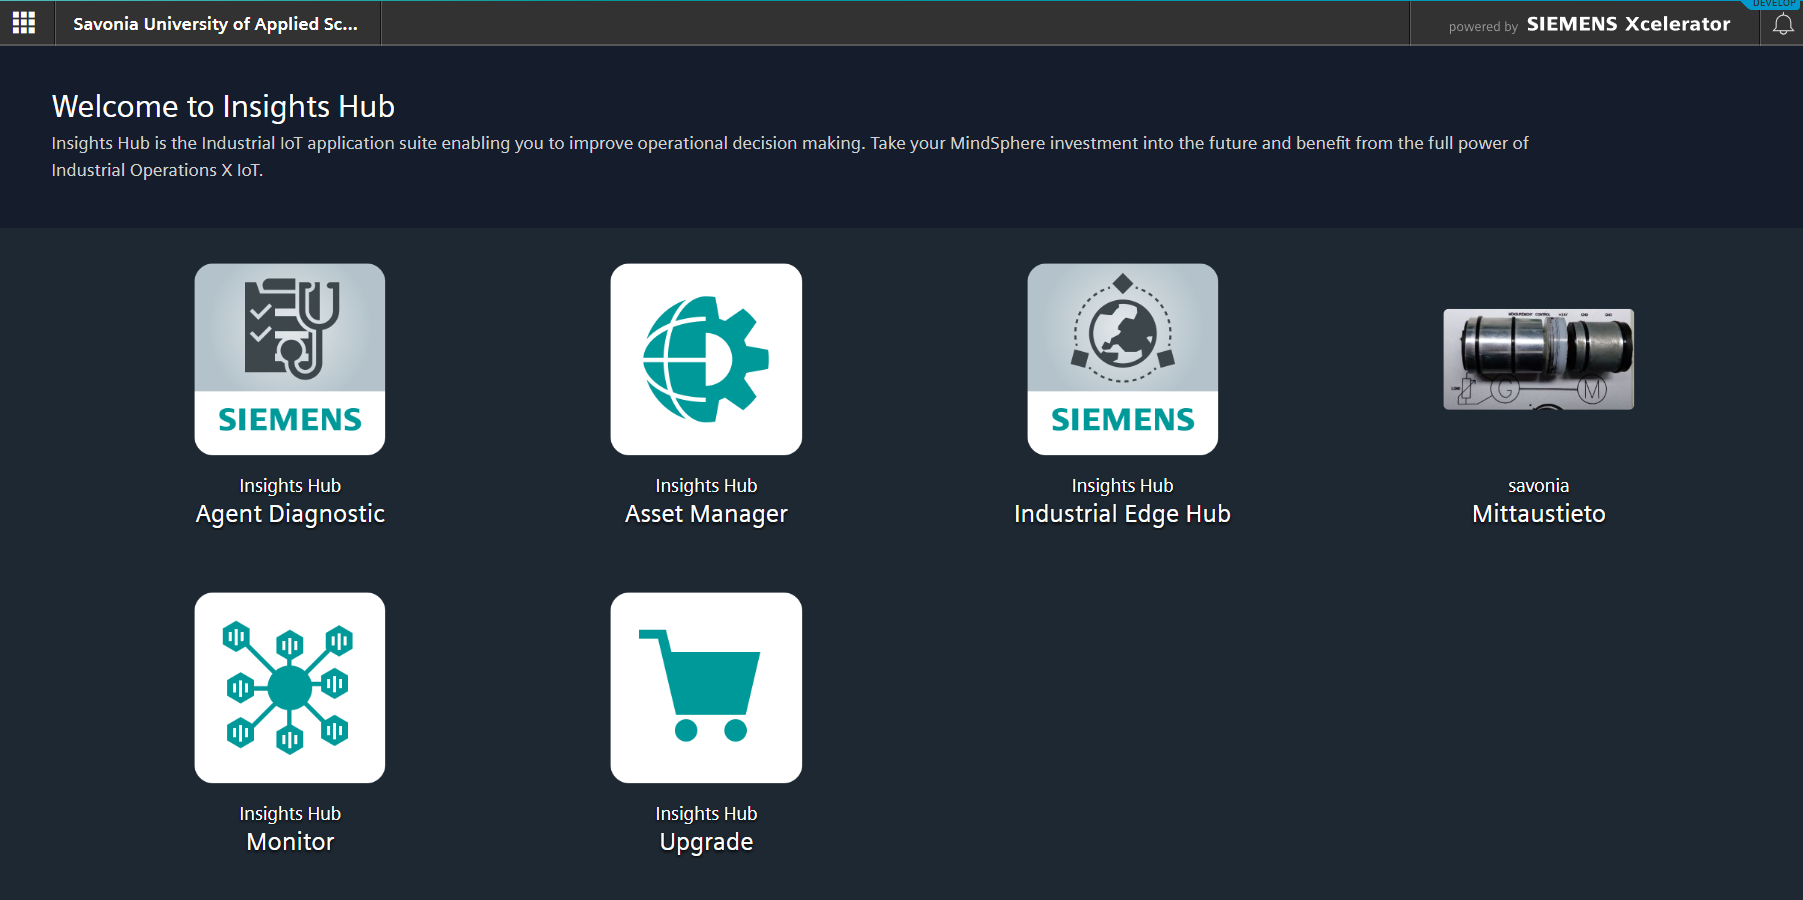
The MindSphere server also supports collaborative features, allowing multiple users to access and share the data. This facilitates teamwork, knowledge sharing, and collaborative decision-making among stakeholders involved in the water level process. Users can collaborate remotely, providing a flexible and efficient means of collectively analyzing and interpreting the data. Figure 9 shows mindsphere server home page.
Furthermore, the MindSphere server ensures data security and privacy by implementing robust security measures. It utilizes encryption protocols, access controls, and authentication mechanisms to safeguard the data and ensure that only authorized users have access to it. This ensures the confidentiality and integrity of the data, mitigating the risk of unauthorized access or data breaches.
RESULT
MindSphere Platform
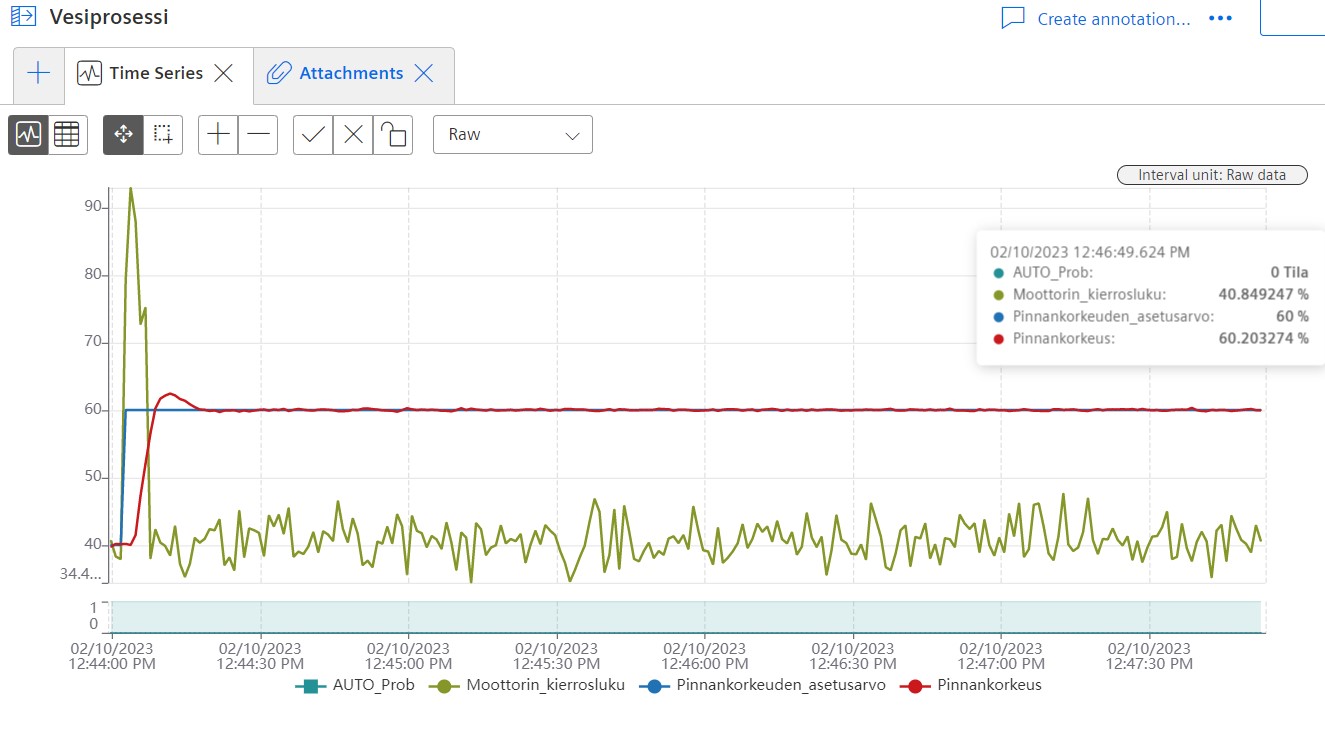
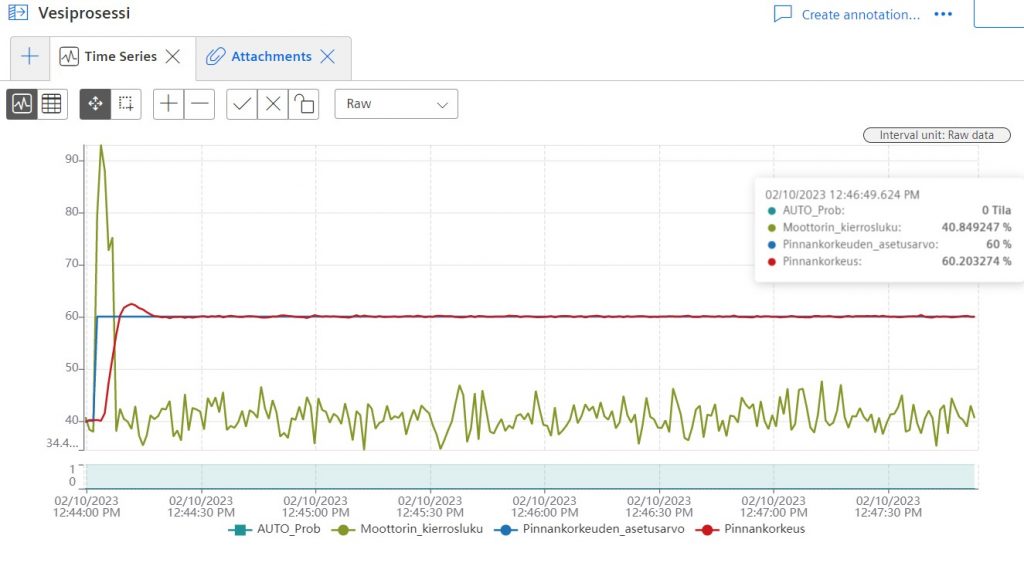
The utilization of PID controllers and Mindsphere in process control is deemed highly beneficial. The control variables of a system can be adjusted in real time by PID controllers, resulting in more stable and accurate control, reduced variability, and improved overall performance. Similarly, Mindsphere offers a powerful platform for data analysis, visualization, and real-time remote moni-toring. When combined, these technologies enable processes to be optimized, downtime to be reduced, and efficiency to be improved. Figure 10 shows results of the project.
Digital Twin Using Excel Simulator
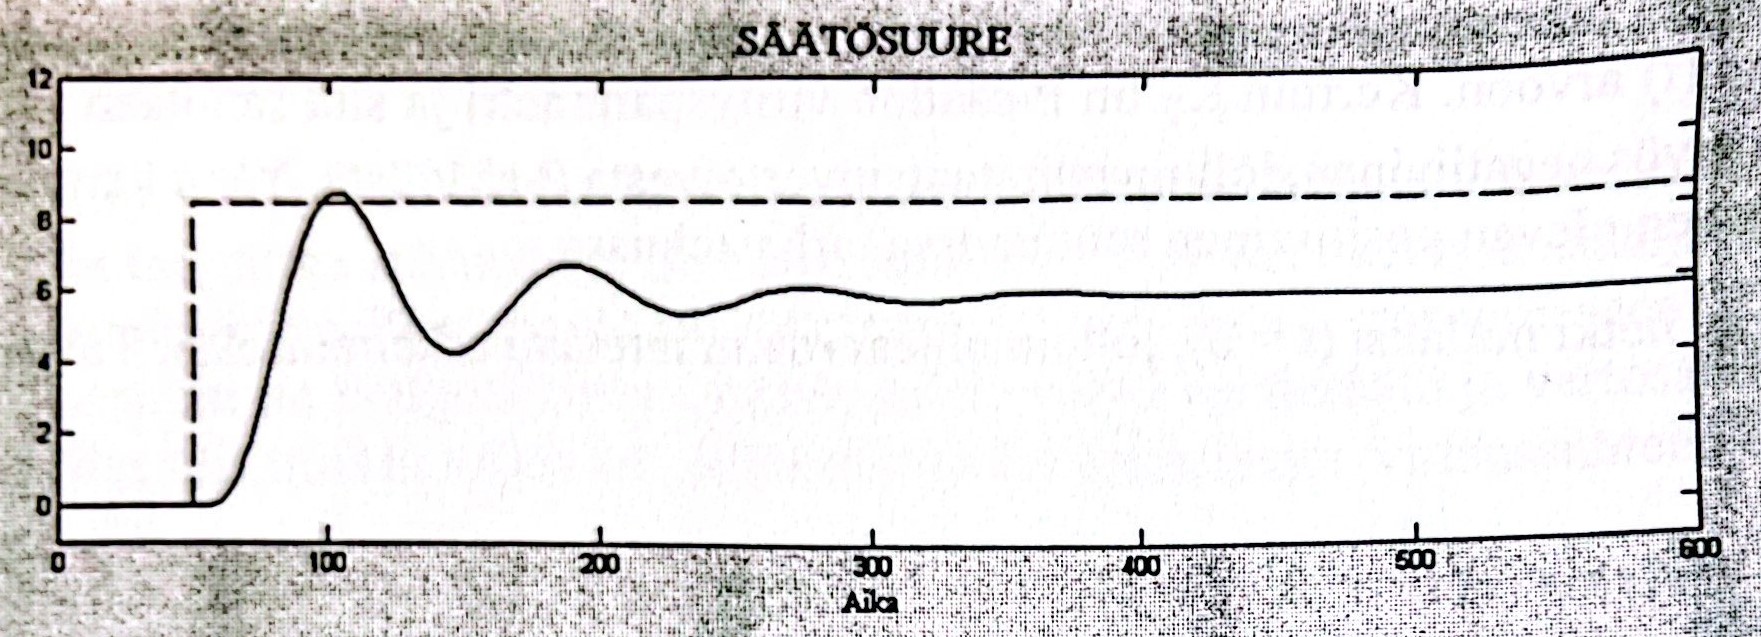
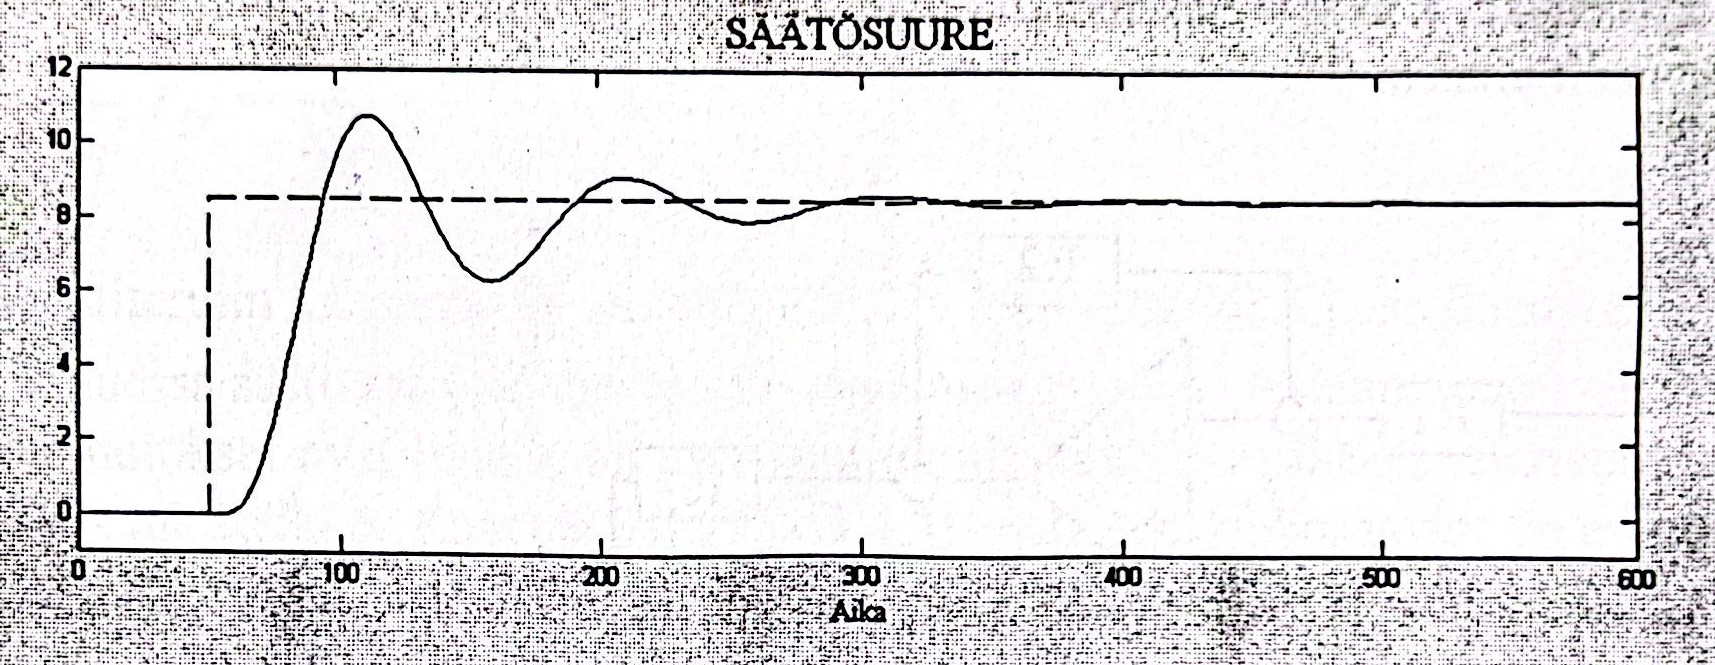
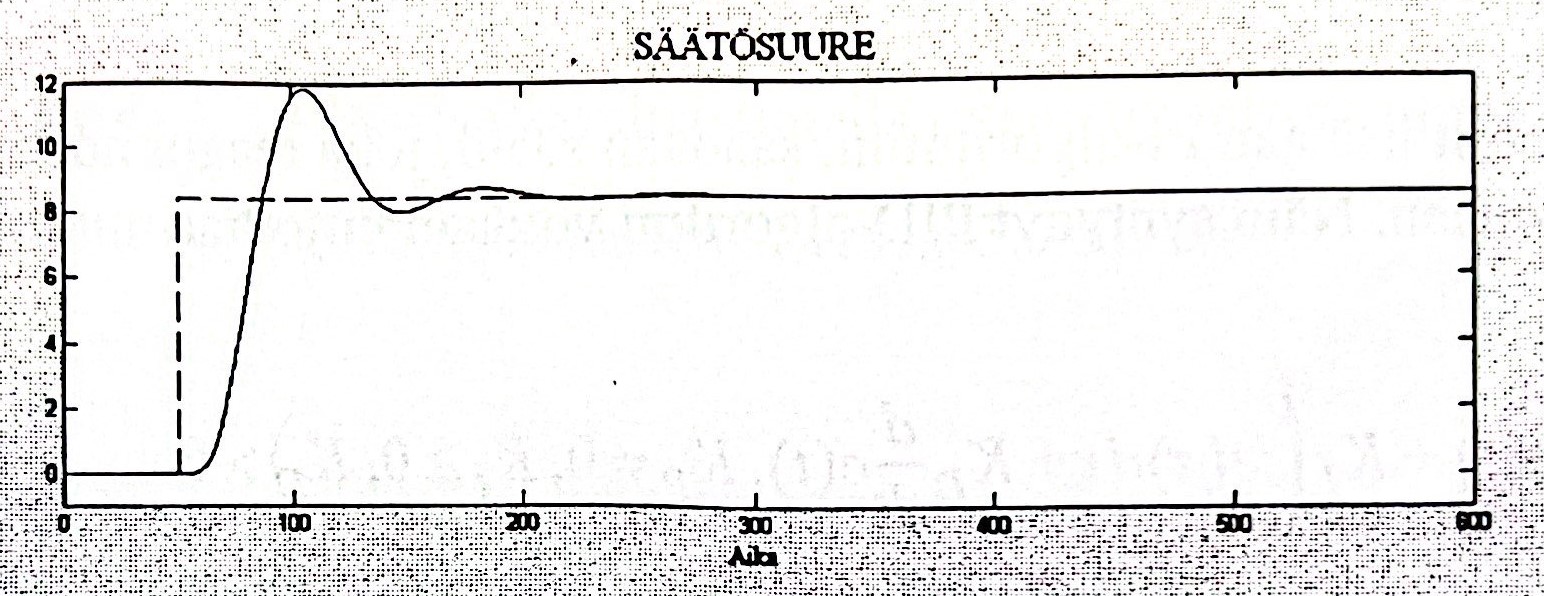
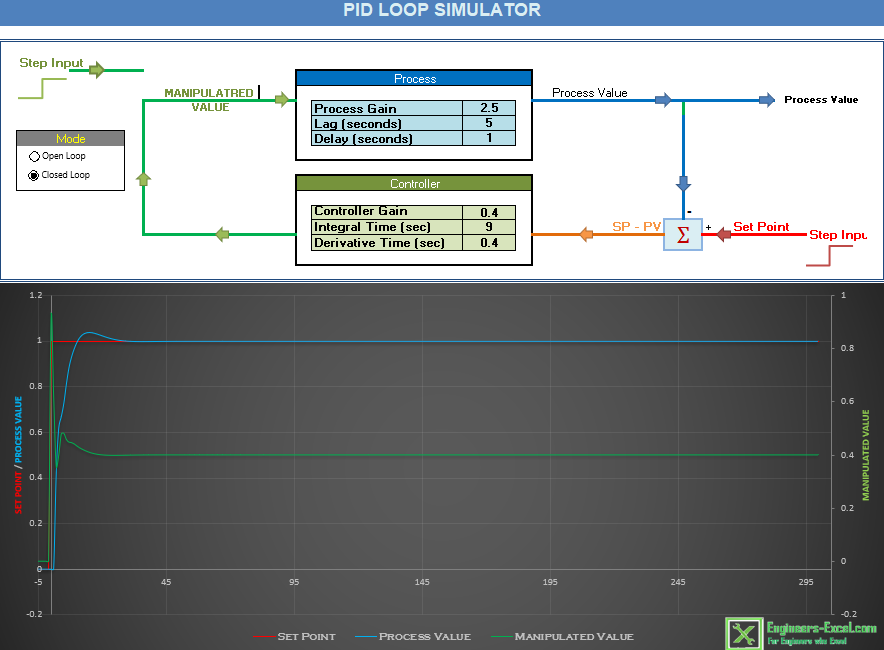
The development of the digital twin using the excel simulator is a significant aspect of this pro-ject. The digital twin serves as a virtual replica of the water level process, providing a simulated environment for testing, analysis, and optimization. Using the excel simulator, the digital twin replicates the dynamics and characteristics of the actual water level process. It takes into ac-count factors such as sensor inputs, actuator responses, and control algorithms to accurately simulate the behavior of the real system. By implementing mathematical models and algorithms, the excel simulator enables the digital twin to mimic the operational aspects of the water level process. The excel simulator provides visualization tools and data analysis capabilities that enable users to observe and interpret the simulation results. Graphs, charts, and reports can be generated to analyze key performance indicators, identify bottlenecks, and uncover opportunities for process optimization. Figure 11 refer result of this.
The development of the digital twin using the excel simulator is a valuable component of this pro-ject. It creates a virtual replica of the water level process, enabling simulation, analysis, and op-timization. By leveraging the capabilities of the excel simulator, the digital twin facilitates testing, experimentation, and performance evaluation in a safe and controlled environment. This aids in the development and improvement of the water level process, leading to enhanced operational efficiency and effectiveness.
CONCLUSION
The outcomes of this project have practical implications in various industrial and infrastructure systems that rely on effective water level monitoring and control. By leveraging the advancements achieved through this project, operators and engineers can make data-driven decisions, optimize processes, reduce downtime, and improve overall system performance. As technology continues to advance, there are opportunities for further research and development in the field of water level process optimization. Future work may involve exploring advanced control algorithms, incorporating machine learning techniques for predictive analysis, and enhancing the integration of cloud-based platforms for real-time monitoring and remote control.
In conclusion, the successful implementation of the mindsphere water level process cloud data analysis project has provided valuable insights and practical solutions for optimizing water level processes using modern technologies. This project serves as a steppingstone towards achieving efficient and reliable water level control in various industrial and infrastructure applications.
Watch The Video
Note: Please be advised that if you encounter difficulties viewing the video, we recommend utilizing the Google Chrome web browser.
Question
Question 1. How to find data on MindSphere mentioned time by using operation insight?
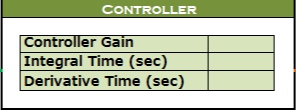
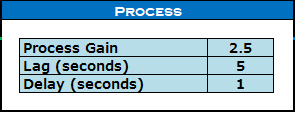
Question 2. Use an Excel file and make the same kind of graph by PID Loop Simulator. Put the controller values. Try to get the same kind of picture to get a digital twin. Here, is the given value.

Authors :
Md. Sajib Pramanic, IoT Student, Savonia University of Applied Sciences, Md.Sajib.Pramanic@edu.savonia.fi
Stanislav Kolosov, IoT student, Savonia University of Applied Sciences, Stanislav.Kolosov@edu.savonia.fi
Project has done by:
Md. Sajib Pramanic, Savonia University of Applied Sciences, Md.Sajib.Pramanic@edu.savonia.fi
Stanislav Kolosov, IoT student, Savonia University of Applied Sciences, Stanislav.Kolosov@edu.savonia.fi
Supervision:
Arto Toppinen, Principal Lecturer, Savonia University of Applied Sciences, Arto.Toppinen@savonia.fi
Rajeev Kanth, Principal Lecturer, Savonia University of Applied Sciences, Rajeev.kanth@savonia.fi
Pasi Lepistö, Senior Lecturer, Savonia University of Applied Sciences, Pasi.Lepisto@savonia.fi