
INTRODUCTION OF LEAN MANUFACTURING
The LEAN approach of manufacturing optimizes manufacturing processes and minimizes waste that is a result of inefficiency.
The principle was developed by Toyota in the 1940s and it was based on the idea of having continuous processes and all employees were involved in the manufacturing.
WHY IMPORTANT TO GET OF WASTE
Waste causes inefficiency in the manufacturing process. By getting rid of the waste the efficiency of the manufacturing process is optimizer and it assists the manufacturer to have processes that require less human labor, less money, less time and also less space in order to deliver products and also services that cost less to the consumer and also have fewer defects.
Core Principles of LEAN Manufacturing
The 5 core principles of LEAN manufacturing are:
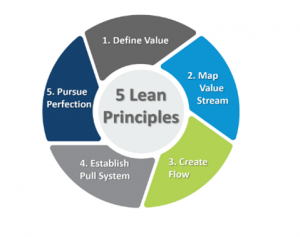
Flow- The manufacturer has to ensure that work flow as seamlessly as possible.
Value- The ability to define value from the perception of the consumer.
Pull- To produce only what is needed by the consumer at the time that it is indeed needed by the consumer.
Value stream- This involves identification of the value stream and also the elimination of activities that don’t add value or rather non-value activities.
Continuous Improvement- The continuous improvement of the process by eliminating waste and also increasing efficiency.
INTRODUCTION TO THE VISUAL COMPONENTS TOOL
VISUAL COMPONENTS
Visual components are a Three-Dimensional manufacturing simulation and manufacturing software that is used for purposes for not only designing but also optimizing production and manufacturing processes. It’s interface is user-friendly for construction of 3D models of manufacturing and production processes. The Visual Components tools includes conveners, robots, and other components that one would like to have in their factory.
The software is used in different industries such as aerospace, electronics, automotive and also in producing consumer goods in order to apply the LEAN principles of manufacturing.
Pressing Line Models
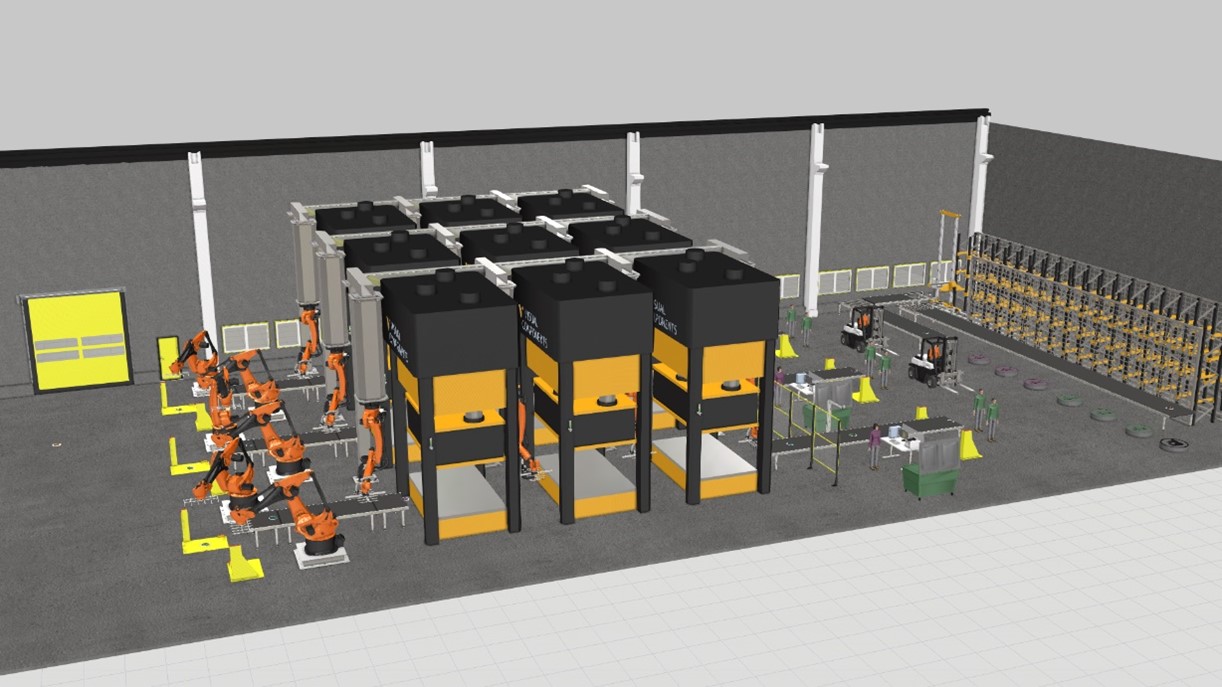
To prove our hypothesis, two models of a simple pressing line factory were developed. A pressing line factory is a factory in which raw metal plates undergo multiple stages of compression to become thin metal sheets of desired dimensions. In the developed models, there are three conveyor lines. The first step in each line is the placing of the metal plates onto the conveyor belts by humans or robot. The metal plates then move along the conveyor belt, after which they undergo a three-stage compression, which are carried out by three different compressors. The plates are placed onto the compressors by robot arms. There is one robot associated with each of the three compressors in all three factory lines. After the compressions, the metals sheets undergo an error check which are done by computers. If the computer shows that the sheet has flaws, then the metal sheet is further checked by a human. If the metal sheet has errors, it is moved to a box by a human for further examination. The ready metal sheets then move to the end of the conveyor belt, from where they are moved to packages by humans. Once these packages are full, forklifts move the packages to the warehouse for shipping.
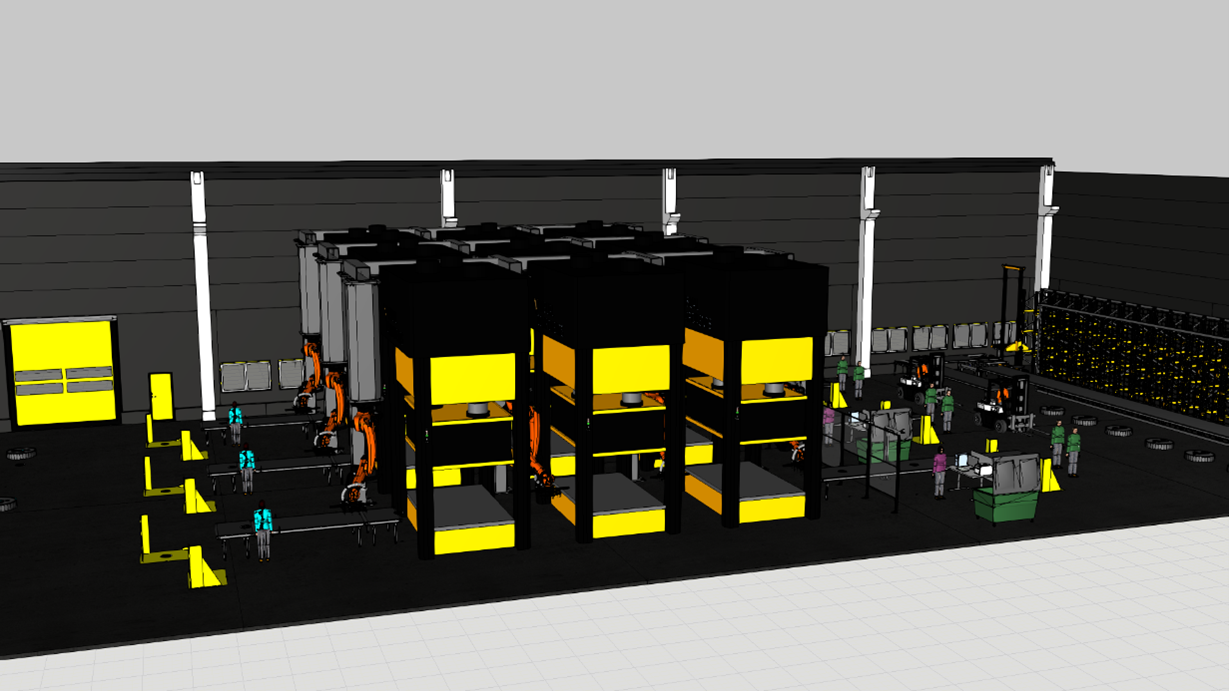
Model 1
In the first pressing line model, the process starts with humans placing the raw metal plates onto the conveyor belts. The plates then undergo the three-stage compression, error check and finally, they are moved to packages, which are moved by forklifts to the warehouse. There are exactly three factory lines in the model. Each line has one human responsible for placing the raw metal plates onto the conveyors, three compressors with a robot arm associated with each one, sensors that check for errors, a human that is responsible for manually checking the error and moving the defective plates out of the conveyor, and finally two humans responsible for taking the finished metal sheets of the conveyor belt and placing them in packages. Furthermore, two forklifts are present in the model, that are responsible for moving the ready packages to the shelves of the warehouse. The humans have different coloured uniforms, depending on their respective responsibilities. In total there are 14 humans in this layout, 4 in each factory line and 2 for the forklifts. Refer to Figure 1. and Figure 2.
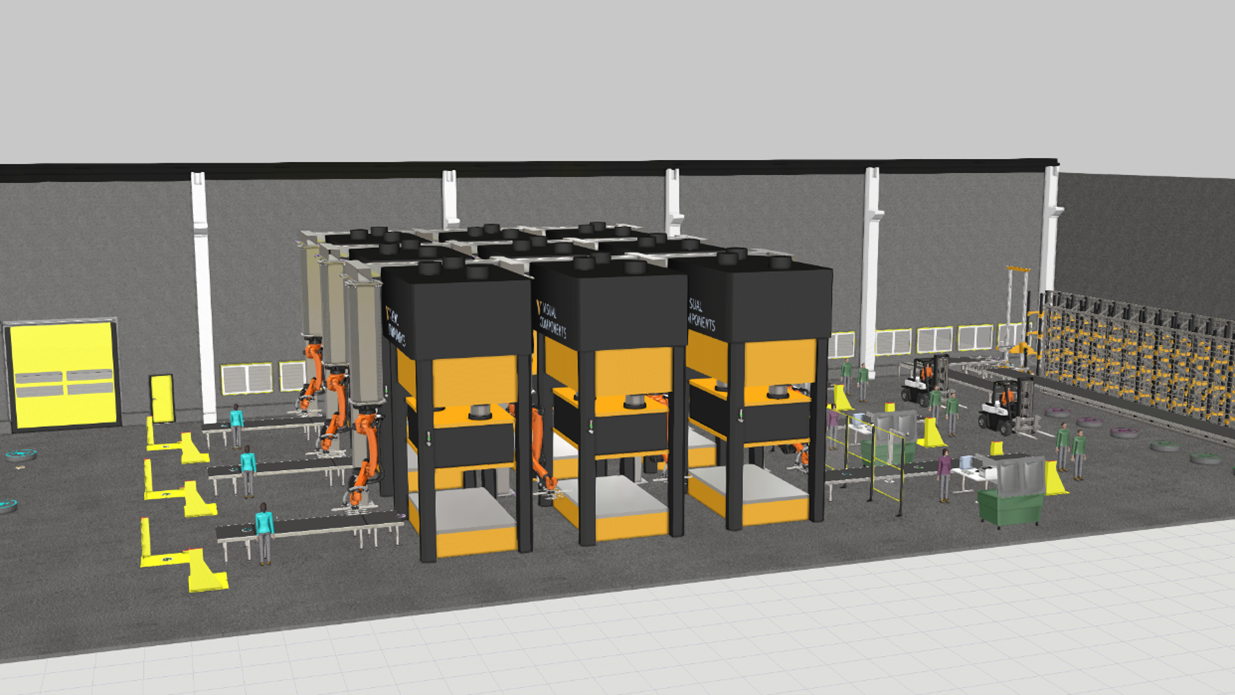
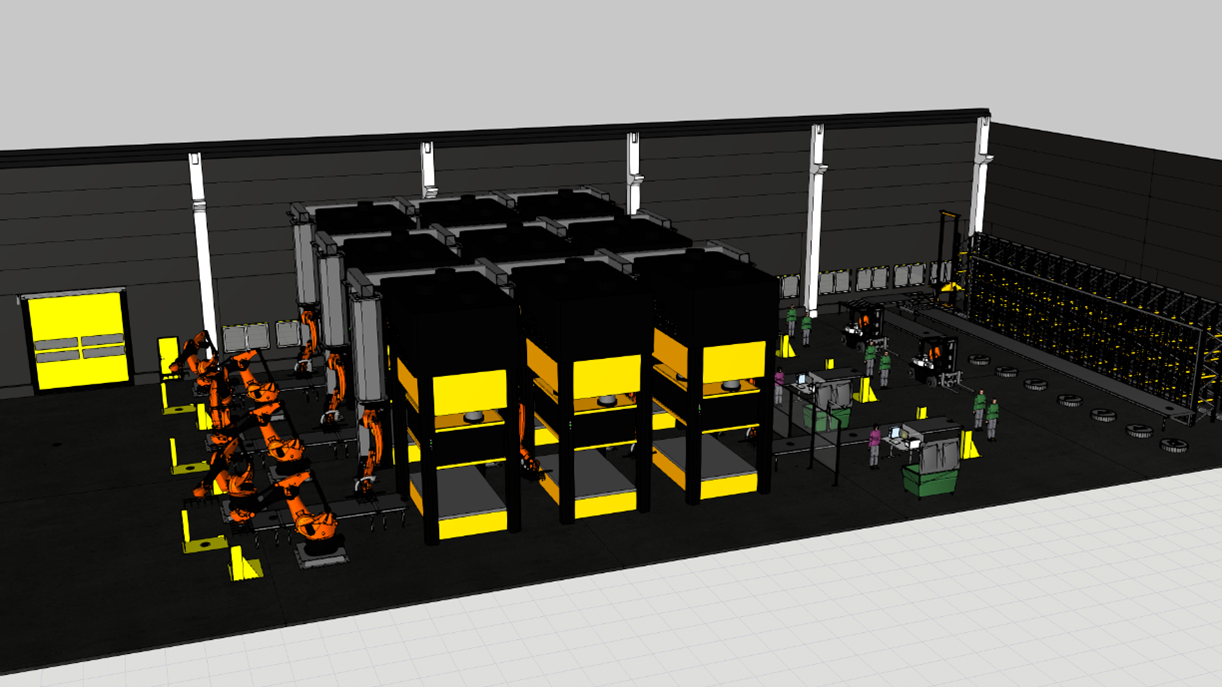
Model 2
The second pressing line model has the same workflow as in the first model; the plates are placed on the belts, they undergo a three-stage compression followed by an error check, and finally they are placed in packaged that are moved by forklifts to the warehouse. The only difference in this design is that instead of having one human responsible for placing the raw metal plates onto the conveyor belts, this job is now done by robots. In this factory layout, each line has two KUKA-robot arms that are responsible for placing the raw metal plates onto to the conveyor belts. So instead of having 14 humans, this layout has 11 humans and 6 robot arms replacing 3 humans. Refer to Figure 3. And Figure 4.
STATISTICS
After programming the layout and defining the tasks of each item in the factory layout, Visual Components allows users to run and see simulations in real times. Furthermore, it allows users to see real time statistics. Visual Components has a very dynamic statistics chart. Once can use it to visualize statistics of the entire factory or the data of an individual item too. Furthermore, this data can be visualized in a variety of different charts, such as line graphs, pie charts, bar graphs and many more.
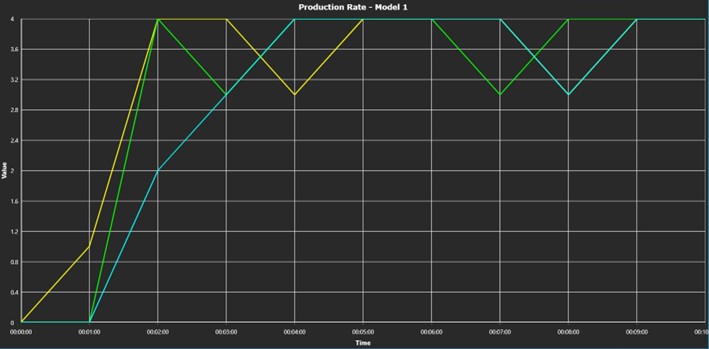
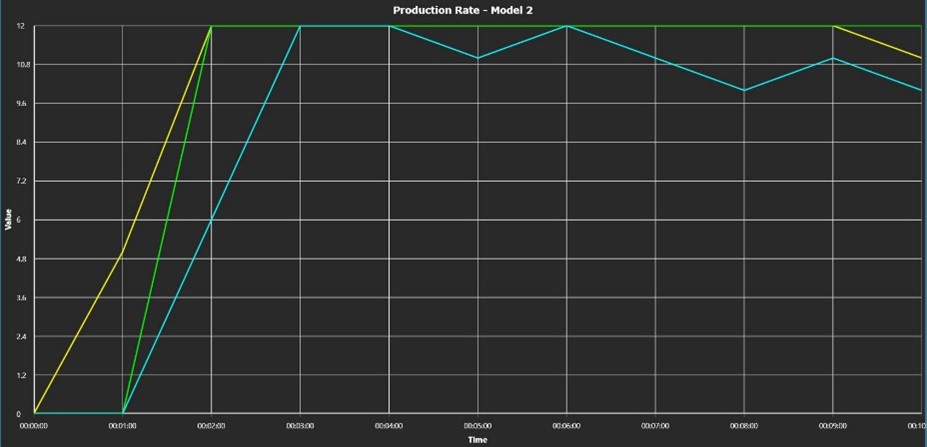
10-minute simulations of both models were recorded for comparison. In the recorded the production rate using line charts (Refer to Figure 6. and Figure 7.) and furthermore for the first model, we used pie charts to record the time spent on different factors by the human responsible for placing the plates onto the conveyor belts (Refer to Figure 5.).
RESULT
An analysis of the first model where the humans were placing the objects on the pressing line was done and it was realised that the utilization of the human placing the plates was almost at 100% (as can be seen in Figure 5.), so the only way to increase productivity would be to increase number of humans, but that would also increase labor costs.
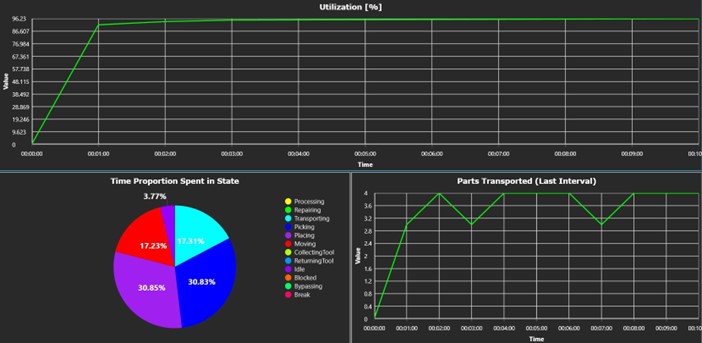
Furthermore, productivity rate was also very minimal (about 4 products produced per minute per conveyor), so since there are 3 lines in this model, about 12 plates were being produced every minute.
An analysis of the second model where the robots were placing the objects on the pressing line was done and it was realised that the productivity rate increased by +200% (from 4 to about 12 plates produced per minute per row), so a total of about 36 finished plates every minute. Additionally labour costs are also decreased by about 21% (assuming all human labour in the factory have the same wage), since now there are only 11 humans, instead of 14. But now, the initial costs are increased, since there are KUKA robots responsible for placing the plates onto the conveyor belt.
Conclusion
Model 2, the one with robots placing the objects, when compared to the other solutions that we had developed was found to be the most viable solution due to it being the most cost-effective solution and because it would also guarantee the manufacturer 100% utilization and also an increase in the number of products being manufactured. We have to ensure that there is no time being wasted in the manufacturing process in order for the manufacturing process to be 100% efficient.
Despite the initial model having a utilization of 96%, it was not as efficient, and hence we had to develop other solutions that would have a proper application of the LEAN Manufacturing principles.
In conclusion, the use of Visual Components software for manufacturing simulation and optimization proved to be highly effective in this project. By applying the LEAN principles of manufacturing and developing two factory models with different layouts, we were able to determine which layout was more efficient. The real-time statistics provided by Visual Components allowed for accurate evaluation of the efficiency of each model. Our project serves as an example of how Visual Components can be used to solve efficiency and optimization problems in real-life industries.
Watch The Video
Note: Please be advised that if you encounter difficulties viewing the video, we recommend utilizing the Google Chrome web browser.
Question
Question 1: Does replacing human labour with machines help in increasing the productivity of a factory? Also think about situations where it would be more optimal to have humans instead of robots.
Question 2: Look at the statistics charts of the two pressing line models given above. Which factory is model is more efficient and why?
Question 3: What are the 5 core principles of LEAN Manufacturing, and why are they used?

Authors :
Shahil Sharma, IoT student, Savonia University of Applied Sciences, Shahil.Sharma@edu.savonia.fi
Suubi Lubaale, IoT student, Savonia University of Applied Sciences, Suubi.Lubaale@edu.savonia.fi
Project has done by:
Shahil Sharma, IoT student, Savonia University of Applied Sciences, Shahil.Sharma@edu.savonia.fi
Suubi Lubaale, IoT student, Savonia University of Applied Sciences, Suubi.Lubaale@edu.savonia.fi
Supervision:
Arto Toppinen, Principal Lecturer, Savonia University of Applied Sciences, Arto.Toppinen@savonia.fi
Rajeev Kanth, Principal Lecturer, Savonia University of Applied Sciences, Rajeev.kanth@savonia.fi
Pasi Lepistö, Senior Lecturer, Savonia University of Applied Sciences, Pasi.Lepisto@savonia.fi