
INTRODUCTION
In recent years, the convergence of advanced technologies and the manufacturing industry has paved the way for the concept of the Smart Factory, revolutionizing traditional manufacturing processes. The Smart Factory integrates Internet of Things (IoT) devices, data analytics, and automation to create an interconnected and intelligent manufacturing environment. By leveraging real-time data and analytics, Smart Factories aim to improve operational efficiency, optimize re-source allocation, and enhance decision-making processes.
This project focuses on the implementation and analysis of cloud data analysis techniques within a Smart Factory environment. The data obtained from the Smart Factory is seamlessly transmitted and stored on the MindSphere server, a leading cloud-based platform for industrial IoT. By harnessing the power of cloud computing, the collected data is processed, analyzed, and transformed into actionable insights.
One of the key objectives of this project was to develop an Augmented Reality (AR) system specifically tailored for the Savonia University of Applied Sciences Smart Factory. Augmented Reality technology overlays virtual information onto the real-world environment, providing an interactive and immersive experience. By integrating AR within the Smart Factory, operators gain access to a virtual overlay of information, enabling improved visualization, monitoring, and decision-making capabilities.
The scope of this project extends beyond the development of the AR system. It also encompasses the analysis of the condition of the factory’s equipment and the overall operational performance. By analyzing the collected data, it becomes possible to identify patterns, anomalies, and inefficiencies within the manufacturing processes. This analysis plays a crucial role in improving the overall efficiency and productivity of the Smart Factory. The integration of cloud data analysis techniques and the development of an AR system hold immense potential for enhancing the capabilities of Smart Factories. By combining real-time data analysis with virtual visualization, operators gain a comprehensive understanding of the factory’s operations, enabling proactive decision-making and timely interventions. This internship project explores the practical applications of these technologies within the context of the Savonia University of Applied Sciences Smart Factory.
The remainder of this report will detail the methodology employed, the process of data collection and analysis, the development of the AR system, and the outcomes achieved. Furthermore, the report will discuss the implications and potential future advancements in the field of Smart Factory technologies. Ultimately, this project aims to contribute to the growing body of knowledge surrounding Industry 4.0 and provide valuable insights for optimizing manufacturing processes and decision-making strategies within similar industrial contexts.
DISTRIBUTED MANUFACTURING
Savonia Smart Factory
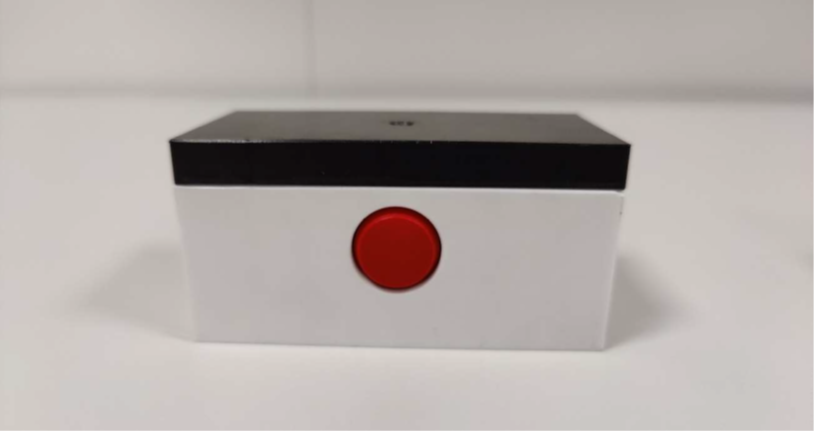
The factory depicted (FIGURE 1) is a compact and intelligent manufacturing facility that specializes in producing simplistic three-piece boxes, as shown in FIGURE 2. These boxes comprise a bottom piece, a top piece, and a bolt that connects them. Designed as an industry 4.0 smart factory, it encompasses all the essential components and hardware required for its operations.
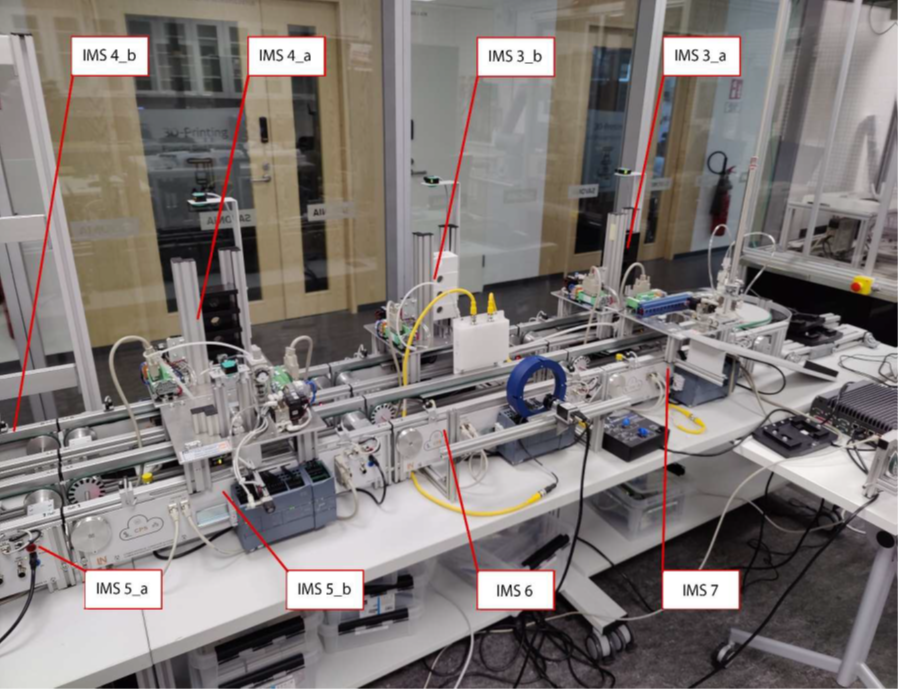
The factory’s hardware consists of modular conveyor belts, which can accommodate stations on top of them. In the basic setup, there are stations for selecting two different colors for each part: black and white for the top and bottom pieces, and metal or red plastic for the bolts. Consequently, there are six stations dedicated to these distinct components. Additionally, there is a station responsible for removing the finished pieces from the carriers. To enhance the setup, this thesis introduces an extra station for conducting quality control before the piece is detached from the carrier. Each conveyor belt is equipped with a programmable logic controller, a motor, two magnetic detection sensors, and an RFID (radio frequency identification) reader/writer. Furthermore, the quality control station’s hardware includes a ring light, a backlight, a camera, and a computer that runs the necessary software.
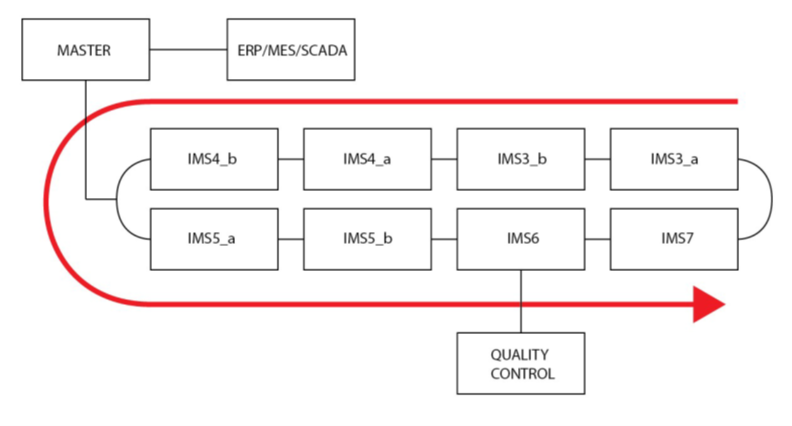
The primary function of the factory involves customers placing orders for their desired boxes through the web shop, which are then manufactured accordingly. The factory is arranged in a loop configuration, employing conveyor belts and stations as illustrated in Figure 1. At the final station, the completed product is removed, allowing the empty carrier to return to the starting point for the subsequent assembly.
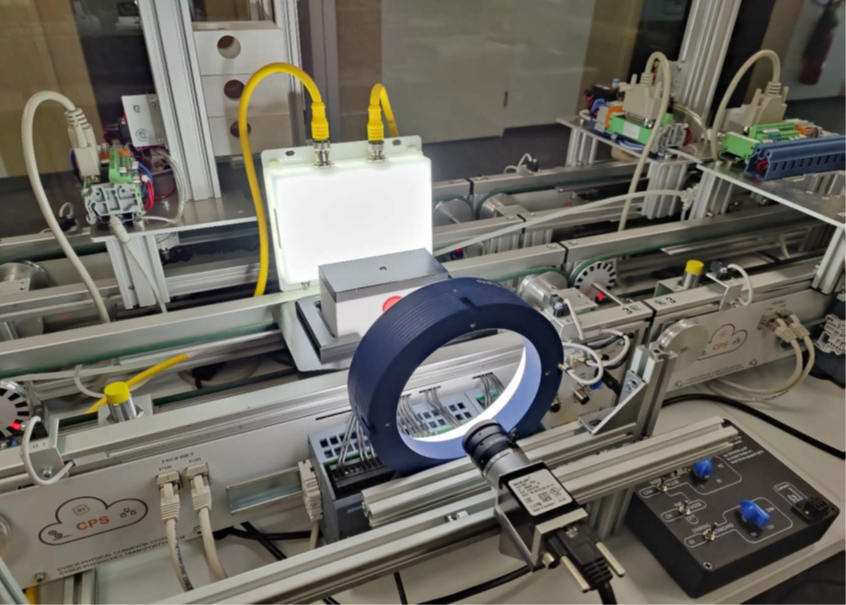
The production process begins with the carrier starting at IMS3_a, where it collects the bottom piece. At IMS3_a, the black piece is available, while IMS3_b offers the white piece. Continuing counterclockwise, the carrier moves to the IMS4 station to retrieve the top piece. IMS4_a provides the white top piece, and IMS4_b supplies the black top piece. Proceeding along, the next stations, IMS5_a and IMS5_b, offer the option to add an optional bolt. IMS5_a presents a red bolt, and IMS5_b provides a metal bolt. Once the product is fully assembled, it proceeds to the IMS6 quality control station (refer to Figure 3). At this point, the station is connected to a PC running machine vision software (marked as “quality control” in Figure 6). The machine vision software is responsible for inspecting the product’s quality. Finally, after the quality control assessment is completed, the product is removed from the factory loop at the IMS7 station. The smart factory at Savonia follows a well-defined setup, as depicted in Figure 1 and Figure 4.
Overall Equipment Effectiveness (OEE)
OEE is a key performance metric used to measure and evaluate the efficiency and productivity of equipment or machinery in a manufacturing environment. It provides insights into how effectively the equipment is being utilized and how well it is performing in terms of availability, performance, and quality.
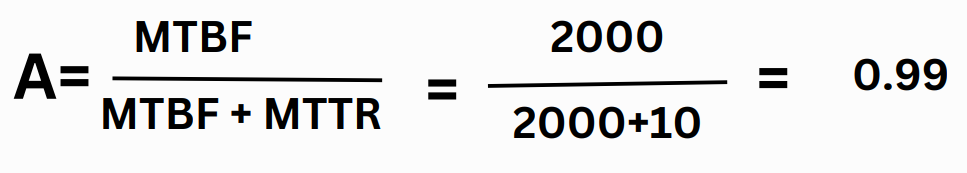
Availability: This component measures the percentage of time that the equipment is available for production. The scale is 0 to 1.
Performance: The performance component of OEE assesses how efficiently the equipment is operating relative to its maximum potential. It considers factors such as production speed, cycle time, and the occurrence of minor stoppages.
Quality: The quality component of OEE evaluates the percentage of good-quality products or output that the equipment generates. It takes into consideration the number of defects, rework, scrap, or any other quality issues that affect the overall quality of the produced goods.
The OEE formula is calculated by multiplying the availability, performance, and quality percentages:
OEE = Availability% × Performance% × Quality%
Main Idea of Distributed Manufacturing
The project’s concept revolves around empowering customers to select their desired products through a third-party server and place orders using a Python program. Illustrated in Figure A, users of the Smart Factory initiate orders through the COMMON OPENCART platform.
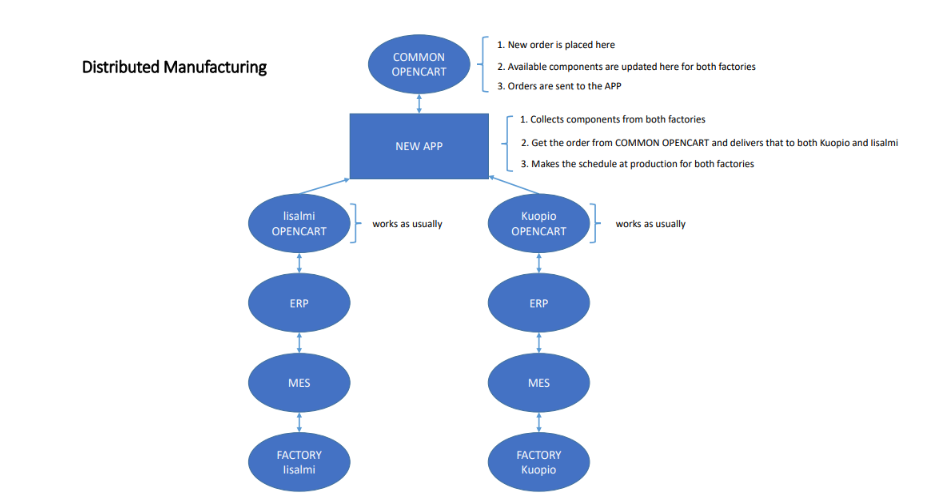
Once orders are correctly placed on the COMMON OPENCART server, customers can transmit these orders. Utilizing a Python script, essential data is extracted from the orders and transmitted to the ERP systems of the Kuopio and Iisalmi smart factories. The connectivity between COMMON OPENCART, the Python script, and the ERP systems is facilitated through API keys. To generate API keys for each OpenCart server, users need to access the admin URL of the OpenCart server, navigate to System -> Users -> API, and click the “Generate” button to obtain the keys. With these API keys, a connection between servers can be established, enabling remote control through the Python script.
Augmented reality (AR)
Introduction of Augmented Reality (AR)
Augmented reality (AR) refers to the seamless integration of digital information into the user’s re-al-time environment. Unlike virtual reality (VR) that constructs entirely artificial worlds, AR enhances the real world by overlaying generated perceptual data onto it. The purpose of augmented reality is twofold. first, it can visually modify natural environments, and second, it provides users with supplementary information. The key advantage of AR lies in its ability to merge digital and three-dimensional (3D) elements with an individual’s perception of the physical world. This technology finds applications in a wide range of fields, from aiding decision-making processes to offering entertainment experiences.
AR employs various sensory inputs, such as visuals, sound, and more, and delivers them to users through devices like smartphones or specialized glasses. The information is superimposed onto the user’s view, creating an intertwined experience where digital content interacts with the real-world environment. This overlay can either add new elements to the surroundings or conceal parts of the natural environment, enhancing the user’s overall perception and interaction with the world around them.
How does augmented reality work?
Augmented reality (AR) can be experienced through various platforms, including smartphones, tablets, and glasses. Researchers are also working on delivering AR through contact lenses. To enable AR functionality, specific hardware components are required, such as processors, sensors, displays, and input devices. Most mobile devices already come equipped with these components, including cameras, accelerometers, Global Positioning System (GPS), and solid-state compasses, making AR more accessible to the general public. The GPS is utilized to pinpoint the user’s location, while the compass detects the device’s orientation. In more advanced AR applications, like those used in military training, additional features like machine vision, object recognition, and gesture recognition may be incorporated. Due to the computational complexity of AR, devices with limited processing power can offload data processing to external machines to ensure smooth performance. Developers create AR apps using specialized 3D programs that allow them to associate animations or contextual digital information in the computer program with specific augment-ed reality markers in the physical world. When an AR app or browser plugin on a computing de-vice detects digital information from a known marker, it executes the marker’s code and overlays the appropriate image or images onto the real-world view, providing a seamless augmented reality experience.
Develop the AR in Savonia Smart Factory
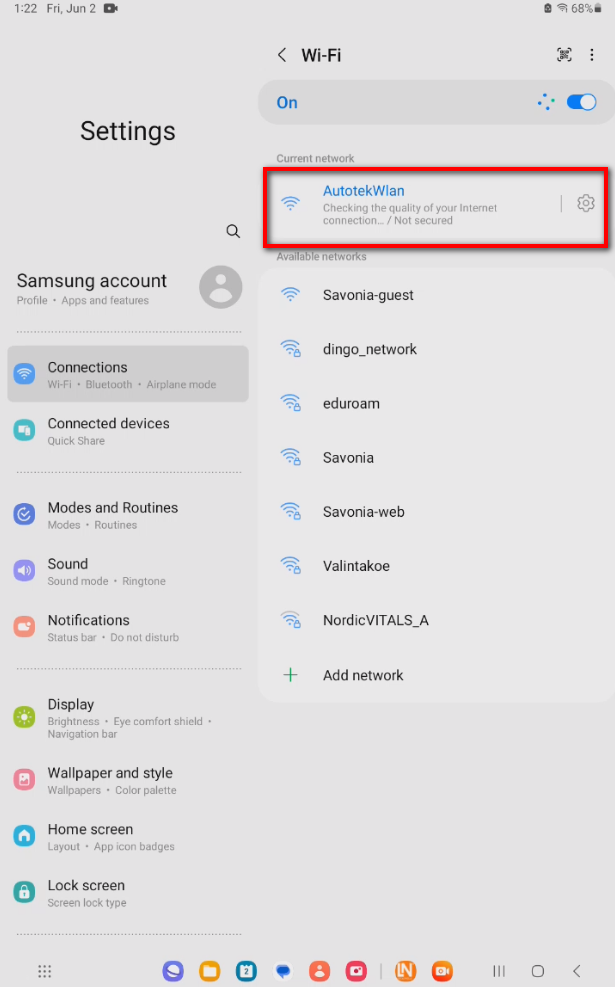
To begin, establish a connection with the smart factory network named AutotekWlan. Figure 5 il-lustrates the details of the current network setup.
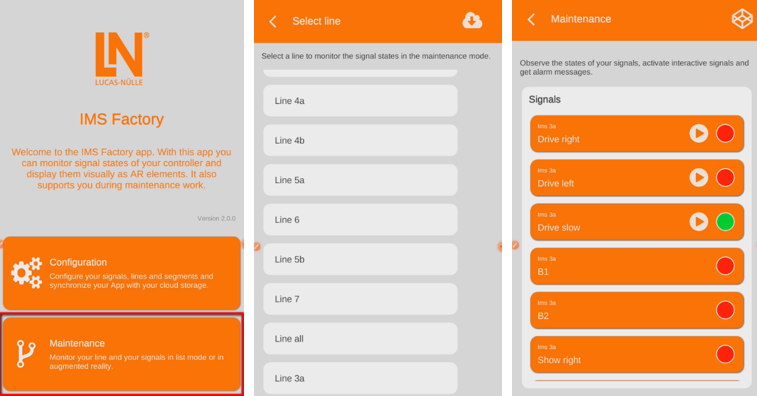
Launch the IMS Factory mobile app by Lucas-Nulle, and proceed to configure the new settings. Then crate new segments and click the create option. Figure 6 refer the configuration option.
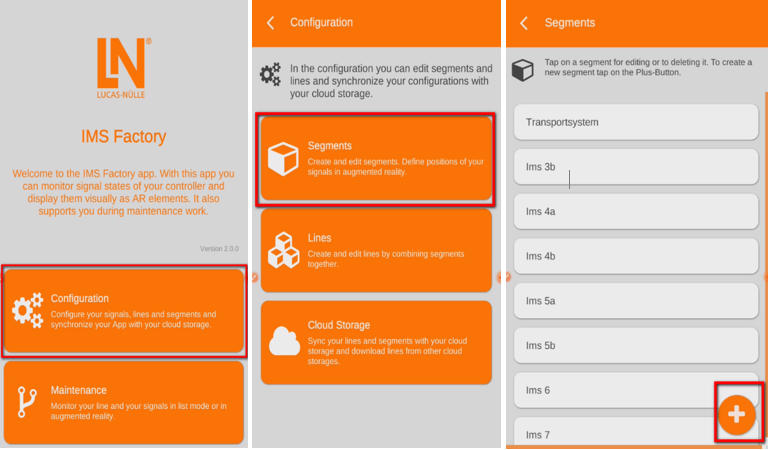
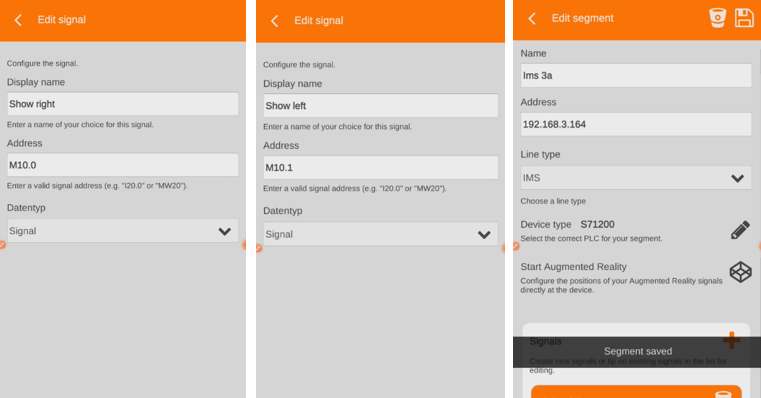
Configure the segment name, IP address and Line type. Create the new signal. Figure 7 refers the segment configuration.
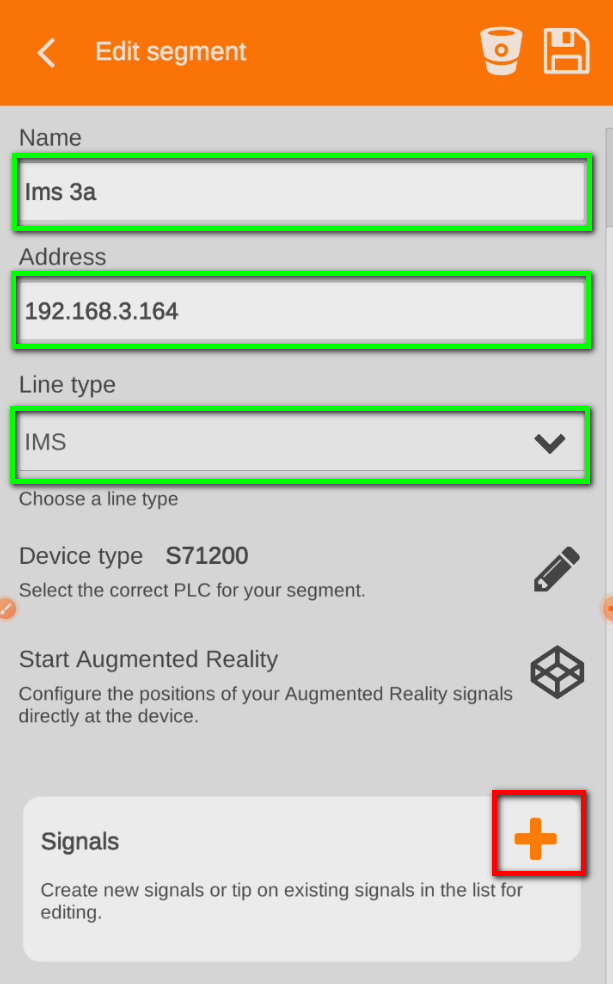
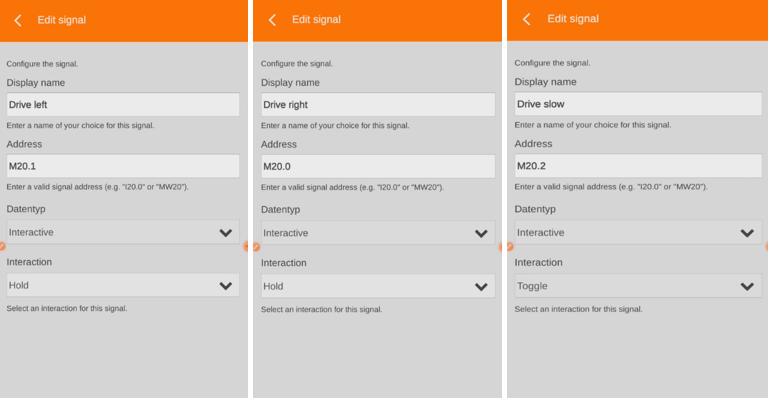
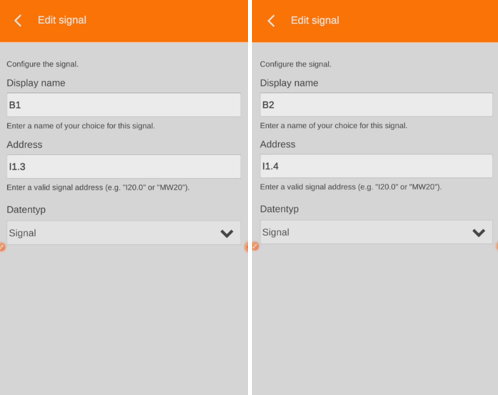
Create the signal for Drive Left, Drive Right and Drive slow. Drive slow signal makes the drive slow. After that create the signal for B1,B2, Show left and Show right. Save it. Figure 8, 9 and 10 shows all the signal configuration.
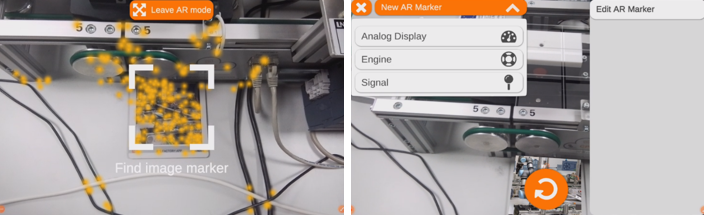
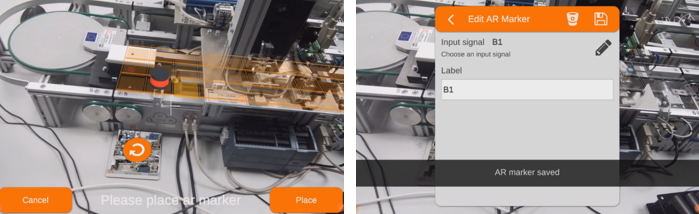
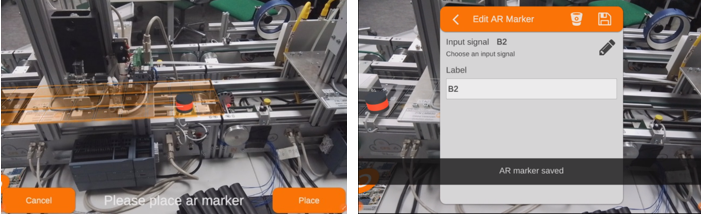
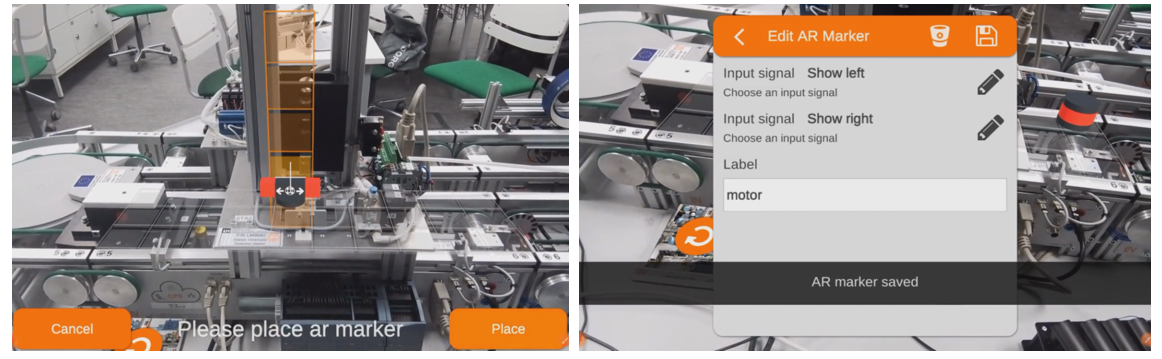
After save the segment need to open start ther augmented reality (see the Figure 9). The scan option shows to scan the smart factory IMS. Place the signal position and add the signal B1, B2 and motor respectively. Figure 11, 12, 13 and 14 refers the signal positions.
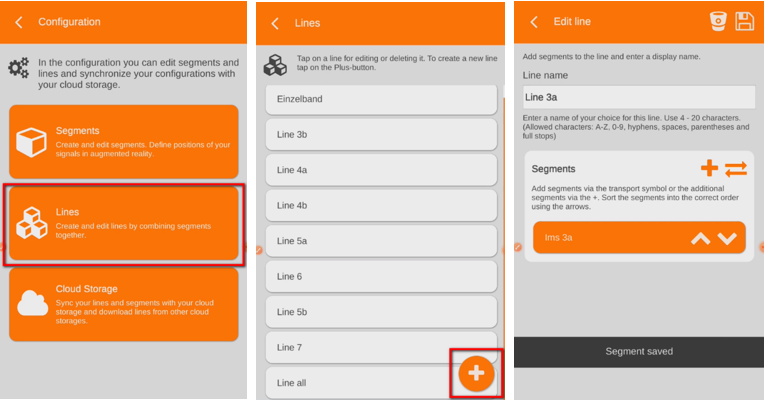
The addition of the line configuration is needed, and the Segment Ims 3a should be added as one of the line options and save it. Figure 15 displays the line configurations.
Through this approach, all the segments can be added. The Maintenance option displays all the lines, each of which is associated with a different signal. Figure 16 illustrates all the lines and signals.
RESULT
Augmented reality (AR)
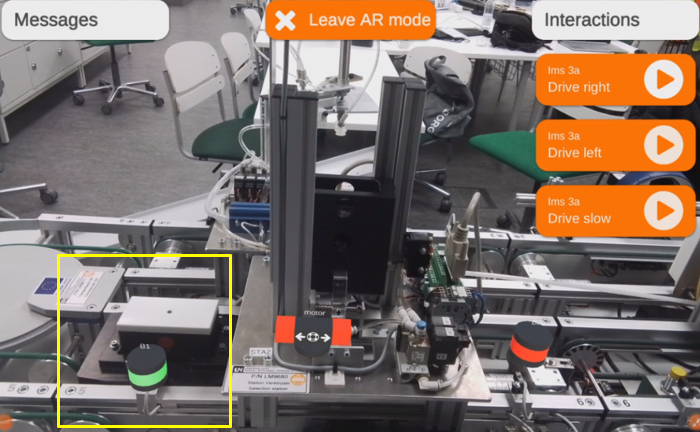
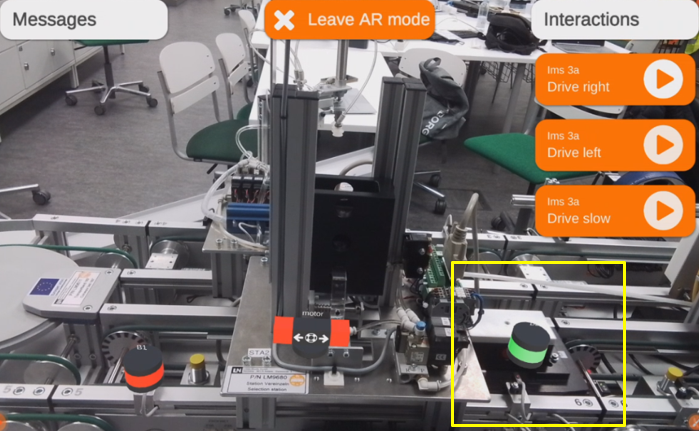
The implementation of Augmented Reality (AR) in the Smart Factory resulted in significant benefits, particularly in signal monitoring and manual operation. Figure 17 demonstrates the effective-ness of the AR system, where the signal accurately corresponds to the product’s proximity to its designated location. When the product approaches the signal, it triggers a correct response, indicated by a green signal in Figure 17, affirming its alignment with the designated signal position. This AR-based monitoring and operation capability have proven to be valuable assets in optimizing the efficiency and accuracy of the Smart Factory’s processes.
MindSphere Platform
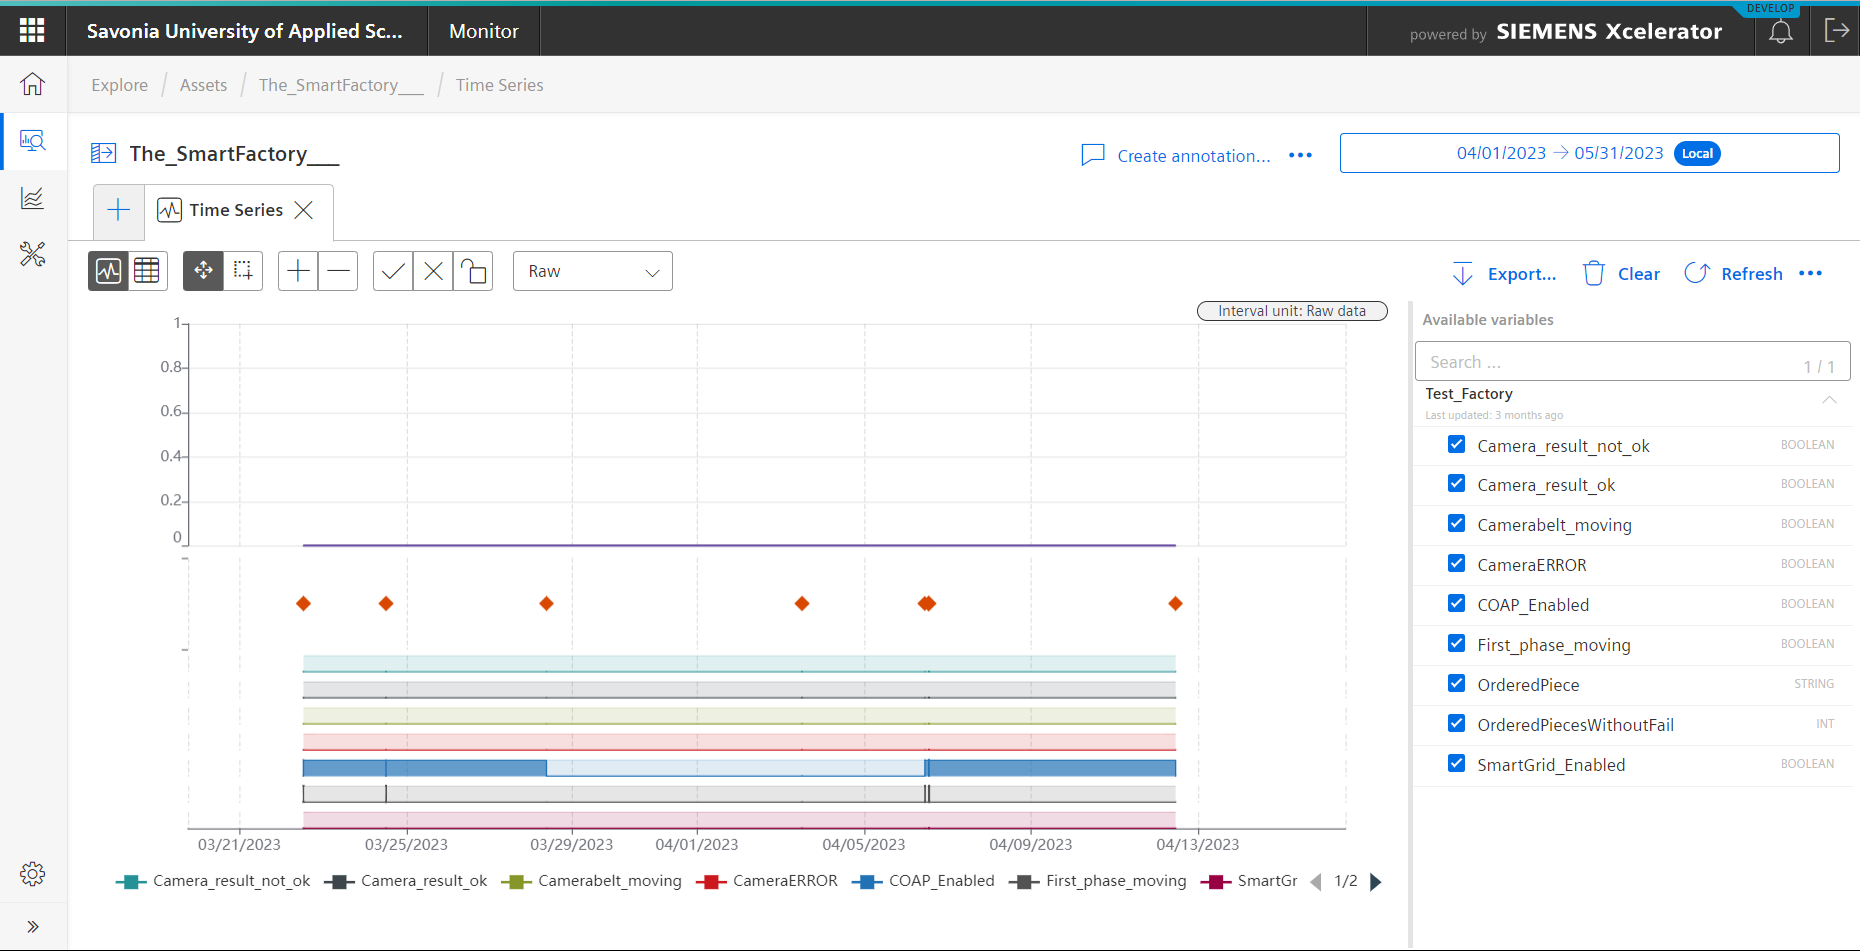
As a result, Mindsphere, developed by Siemens, emerges as a cloud-based and open IoT operating system. It empowers companies to establish connections between their machinery, plants, and assets, enabling data collection from these sources. This data is subsequently analyzed to enhance performance, optimize maintenance procedures, and minimize downtime. The utilization of the MindSphere server acts as a platform for users to access and view the collected data from the water level process. It functions as a centralized repository, efficiently storing and managing the gathered data. The MindSphere server offers a comprehensive set of features and functionalities, empowering users to perform effective data analysis and interpretation.
In Figure 19, the MindSphere server is represented, displaying the results related to camera sta-tus, camera movement, camera errors, COAP enablement, order of pieces, successful piece or-ders, and smart grid data.
CONCLUSION
The implementation of Augmented Reality (AR) within the Smart Factory has yielded significant benefits, particularly in the areas of signal monitoring and manual operations. Figure 16 serves as evidence of the AR system’s effectiveness, showcasing the precise correlation between the signal and the product’s proximity to its designated location. With the product’s approach to the signal, a correct response is triggered, represented by the green signal in Figure 17 and 18, validating its alignment with the designated signal position. This AR-based monitoring and operational capability have proven to be valuable assets, contributing to the optimization of the Smart Factory’s processes, enhancing efficiency, and ensuring accuracy.
In conclusion, the successful implementation of AR and Mindsphere has propelled the Smart Factory towards greater efficiency, precision, and productivity, establishing it as a state of the art manufacturing facility at the forefront of technological advancements in the industry. The amalgamation of these cutting edge technologies holds immense promise for future growth and innovation in the manufacturing landscape.
Watch The Video
Note: Please be advised that if you encounter difficulties viewing the video, we recommend utilizing the Google Chrome web browser.
Questions
Question 7: What is the OEE (Overall Equipment Effectiveness) number, and how can it be calculated?

Authors :
Md. Sajib Pramanic, IoT Student, Savonia University of Applied Sciences, Md.Sajib.Pramanic@edu.savonia.fi
Xiaoyang Zhang, IoT student, Savonia University of Applied Sciences
Project has done by:
Md. Sajib Pramanic, Savonia University of Applied Sciences, Md.Sajib.Pramanic@edu.savonia.fi
Sojat K Sebgaze, IoT student, Savonia University of Applied Sciences, Sojat.Sebgaze@edu.savonia.fi
Supervision:
Arto Toppinen, Principal Lecturer, Savonia University of Applied Sciences, Arto.Toppinen@savonia.fi
Rajeev Kanth, Principal Lecturer, Savonia University of Applied Sciences, Rajeev.kanth@savonia.fi
Pasi Lepistö, Senior Lecturer, Savonia University of Applied Sciences, Pasi.Lepisto@savonia.fi